Relaxed Selection Techniques for
Querying Time-Series Graphs
Christian Holz and Steven Feiner. UIST 2009.
Columbia University, New York, NY.
Figure 1
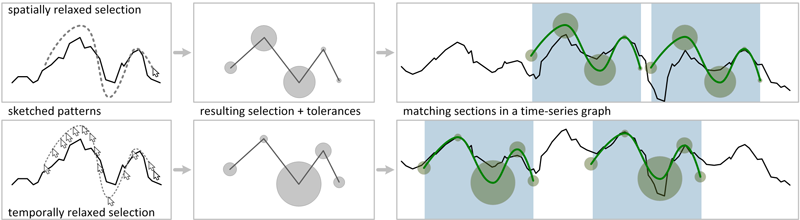
Relaxed selection techniques. Spatially relaxed selection (top): Tolerances are derived from spatial deviations between displayed graph and user sketch on a point-by-point basis. Temporally relaxed selection (bottom): Tolerances are derived from input speed. (Center) In both cases, tolerances can be visualized with circles around points in the selection. (Right) Tolerant selections allow similarity matches for patterns that recur in a time series.
Abstract
Time-series graphs are often used to visualize phenomena that change over time. Common tasks include comparing values at different points in time and searching for specified patterns, either exact or approximate. However, tools that support time-series graphs typically separate query specification from the actual search process, allowing users to adapt the level of similarity only after specifying the pattern. We introduce relaxed selection techniques, in which users implicitly define a level of similarity that can vary across the search pattern, while creating a search query with a single-gesture interaction. Users sketch over part of the graph, establishing the level of similarity through either spatial deviations from the graph, or the speed at which they sketch (temporal deviations). In a user study, participants were significantly faster when using our temporally relaxed selection technique than when using traditional techniques. In addition, they achieved significantly higher precision and recall with our spatially relaxed selection technique compared to traditional techniques.
Video
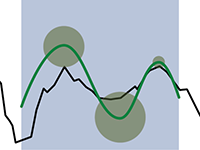
As shown in the video, the application SoftSelect implements two sketch-based selection techniques and approaches to select parts from a graph. Both techniques allow the user to specify fuzzy queries by selecting a part of the graph and relaxing similarity constraints for the query. A subsequent matching process evaluates these relaxed selections and searches for matching patterns in a graph, i.e., it matches the query against all parts of the graph, highlighting those parts that exhibit the pattern within the defined constraints. In a nutshell, a part of a graph is a match if it follows the general pattern of the specified query and passes through the areas of tolerances (relaxed matches, tolerances are visualized with circles).
Publication
@inproceedings{holz2009,
    author = {Holz, Christian and Feiner, Steven},
    title = {Relaxed selection techniques for querying time-series graphs},
    booktitle = {UIST '09: Proceedings of the 22nd annual ACM symposium on
                 User interface software and technology},
    year = {2009},
    isbn = {978-1-60558-745-5},
    pages = {213--222},
    location = {Victoria, BC, Canada},
    doi = {http://doi.acm.org/10.1145/1622176.1622217},
    publisher = {ACM},
    address = {New York, NY, USA},
}
Figures
Figure 2: Pairing
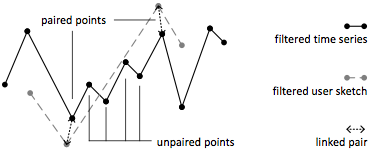
Corresponding points (i.e., corresponding local extrema of the same type) from either series are linked together.
Figure 3: Spatially relaxed selection
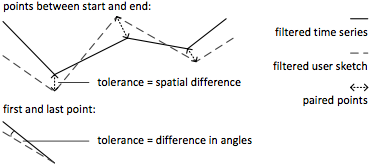
The tolerance for each point in the selection is determined by the distance to its corresponding point in the displayed pattern. Tolerances for the first and last point of the user selection encode the angles of the rays that start at their immediate neighbors.
Figure 4: Temporally relaxed selection, a speed of input aware selection technique
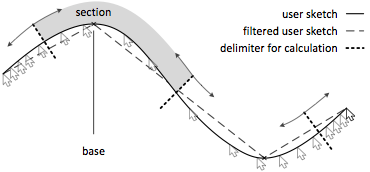
Tolerances of local extrema and start and end points are determined by the time the user spends sketching the sections around them. A section contains all points that are closer to its base than to another base. The derived tolerance of the selection therefore is speed dependent.
Figure 5: Matching process
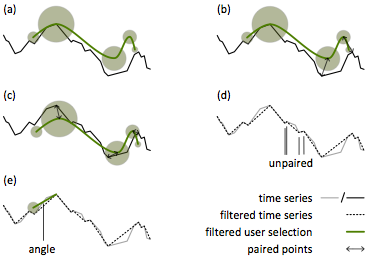
(a) The user selection is overlaid on the filtered time series. (b) Corresponding points are determined. (c) The selection is repositioned so that pairs lie within the same circle. (d) Unpaired points are compared with the noise threshold. (e) For start and end points, angles are compared.
Figure 6: SoftSelect screenshot
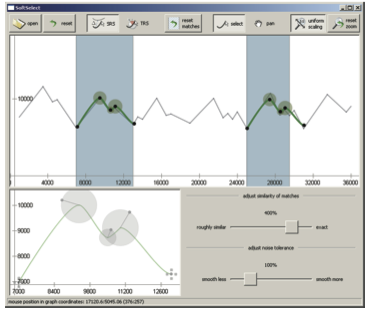
The top part is the graph-display and main-interaction area. The bottom part allows query refinement (dragging query points) and tolerance adjustment (resizing circles).
Figure 7: Selection and adjustment times
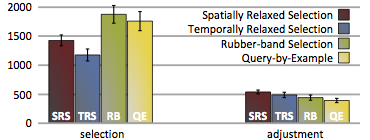
Average times in milliseconds. Error bars indicate standard errors.
Figure 8: Precision and recall of the matching
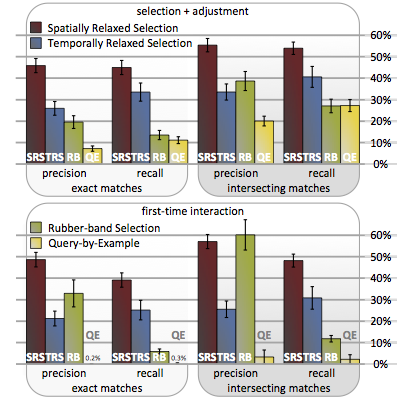
Precision and recall for exact and intersecting matches (more tolerant counting). The first group represents selection and query adjustments; the second shows only initial interaction. Error bars indicate standard errors.
Figure 9: Qualitative feedback
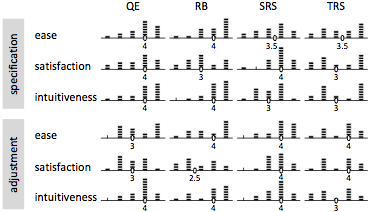
Histograms of participant ratings of the four techniques on a five-point (low to high) Likert scale. Each item in a stack represents a participant who rated the technique with that value. Small numbers are median ratings.
Figure 10: Qualitative ranking
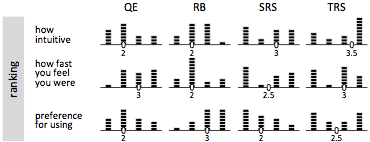
Histograms of participant rankings of techniques from 1 to 4 (high to low). Each item in a stack represents a participant who gave the technique that rank. Small numbers are median ranks.