Understanding Touch
Christian Holz and Patrick Baudisch. CHI 2011.
Hasso Plattner Institute, Potsdam, Germany.
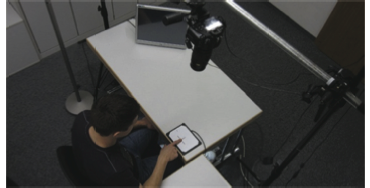
Figure 1
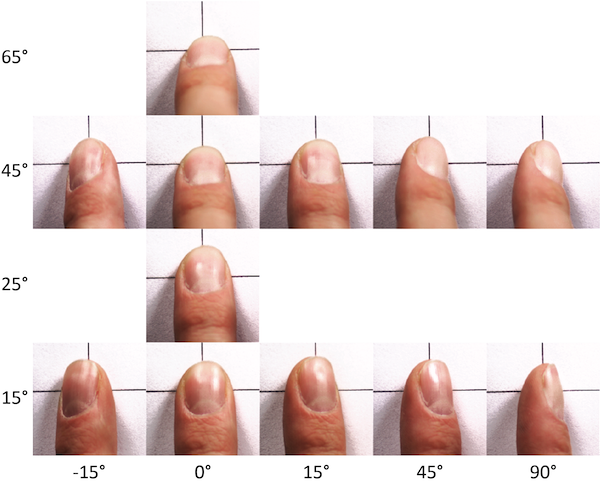
A study participant targeting crosshairs using different finger angles. Can you guess how this user is conceptualizing touch, i.e., what geometric relationship between finger and crosshairs the user is trying to maintain independent of how the finger is held? Our findings suggest that users indeed target as suggested by this illustration, i.e., by aligning finger features and outlines in a hypothesized top-down perspective.
Abstract
Current touch devices, such as capacitive touchscreens are based on the implicit assumption that users acquire targets with the center of the contact area between finger and device. Findings from our previous work indicate, however, that such devices are subject to systematic error offsets. This suggests that the underlying assumption is most likely wrong. In this paper, we therefore revisit this assumption.
In a series of three user studies, we find evidence that the features that users align with the target are visual features. These features are located on the top of the user's fingers, not at the bottom, as assumed by traditional devices. We present the projected center model, under which error offsets drop to 1.6mm, compared to 4mm for the traditional model. This suggests that the new model is indeed a good approximation of how users conceptualize touch input.
The primary contribution of this paper is to help understand touch—one of the key input technologies in human-computer interaction. At the same time, our findings inform the design of future touch input technology. They explain the inaccuracy of traditional touch devices as a "parallax" artifact between user control based on the top of the finger and sensing based on the bottom side of the finger. We conclude that certain camera-based sensing technologies can inherently be more accurate than contact area-based sensing.
Publication
@inproceedings{holz2011ut,
    author = {Holz, Christian and Baudisch, Patrick},
    title = {Understanding touch},
    booktitle = {Proceedings of the 2011 annual conference on
                 Human factors in computing systems},
    series = {CHI '11},
    year = {2011},
    isbn = {978-1-4503-0228-9},
    location = {Vancouver, BC, Canada},
    pages = {2501--2510},
    numpages = {10},
    url = {http://doi.acm.org/10.1145/1978942.1979308},
    doi = {http://doi.acm.org/10.1145/1978942.1979308},
    acmid = {1979308},
    publisher = {ACM},
    address = {New York, NY, USA},
    keywords = {experiment, generalized perceived input point model,
                targeting, touch input}
}
Understanding Touch is a follow-up of the Generalized Perceived Input Point Model in that it explains the effect we found in that work. The inaccuracy touch-input devices measure stems from a parallax error, as users target visually using features located on the top of their fingers, whereas touch devices measure the contact area between finger and device. This parallax error causes touch devices to perceive different input points and thus input errors.
Figures
Figure 2: Touch is a 6D operation
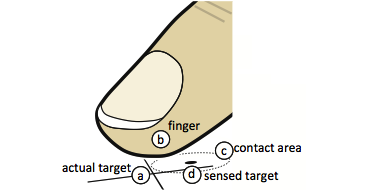
When acquiring a target, here marked with 2D crosshairs (a), users effectively translate the 2D position of the target into a 6D position of their finger. On traditional touch devices, the finger leaves a contact area (c), which is observed by the touch pad and reduced to its 2D centroid (d).
Figure 3: Systematic offsets due to finger angle and user
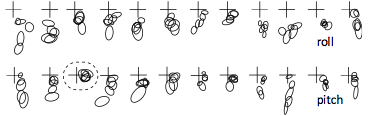
The aggregated contact locations of different finger postures are offset with respect to each other. From the generalized perceived input point model
Figure 4: Setup of the interview study

Before being interviewed, participants acquired targets printed on a sheet of paper.
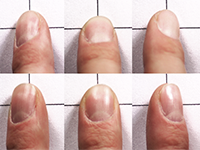
Figure 5: Finger postures
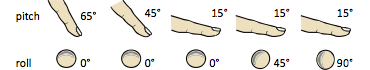
Participants assumed these five different combinations of finger pitch and roll, and then acquired the target.
Figure 6: Aiming using visual feature
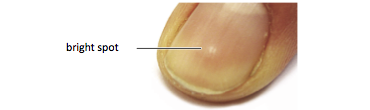
One participant targeted by placing a bright spot on his nail over the target.
Figure 7: Visual features on the finger
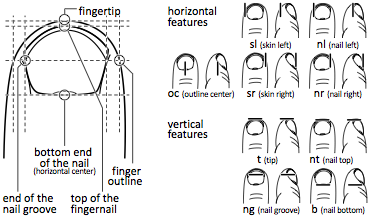
We found these horizontal and vertical features to be detectable and used them to construct candidate models.
Figure 8: Half-models that might explain touch
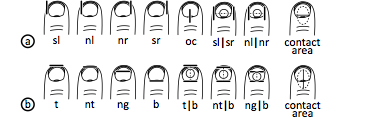
(a) 7 horizontal half models based on the features in Figure 7, plus the contact area based model. (b) 7 vertical half models (+ contact area based).
Figure 9: Study setup using an overhead camera
Participants acquired a crosshair target located on a touchpad and committed input using the footswitch.
Figure 10: Study conditions
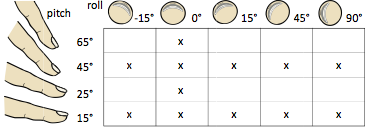
Participants assumed these combinations of finger pitch and finger roll during the study.
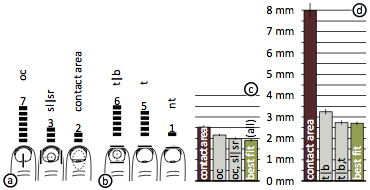
Figure 11: Results of Study 1: vertical half-models
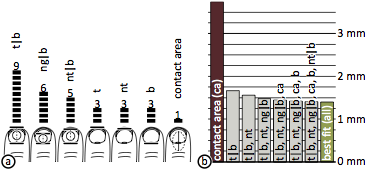
(a) Number of participants for which each vertical half model produced the lowest error. (b) Error produced when using only a subset of the half models to analyze participants. Switching from the model contact area to t|b reduces error offsets to 44%; using all models listed in (a) reduces the error to 37% compared to the contact area model.
Figure 12: Results of Study 1: horizontal half-models
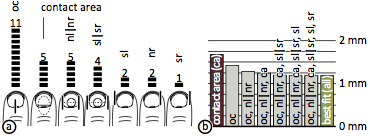
(a) Number of participants for which each horizontal half model produced the lowest-error offsets. (b) Using per-participant half models reduces the error offsets on average to 84% compared to using merely the contact area model.
Figure 13: Varying head positions
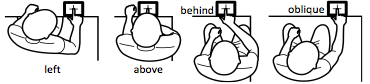
Participants acquired the target from these four different head positions.
Figure 14: Results of Study 2: vertical half-models
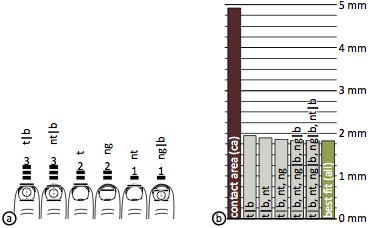
(a) Number of participants for which each vertical half model produced the lowest error. (b) The mean error of input drops to 39% when using t|b instead of contact area.
Figure 15: Results of Study 2: horizontal half-models
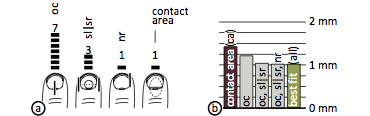
(a) Number of times each of the horizontal models produced the lowest-error offsets per participant. (b) The average error produced by the horizontal best-fit models sinks to 72% compared to contact area. The three horizontal half models oc, sl|sr, and t|b alone account for this improvement.
Figure 16: Remaining candidate models
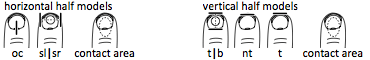
These candidate models remained after removing those half-models that produced a large error.
Figure 17: Study conditions of the final evaluation
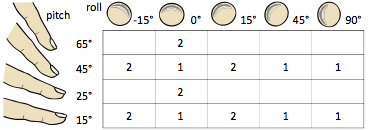
To keep the number of trials per participant manageable, we ran roll/pitch between subjects. The table shows the assignment of conditions to the two groups.
Figure 18: Results of the final evaluation: vertical and horizontal half-models
(a) Number of times each of the horizontal models produced the lowest error. (b) Same for the vertical models. (c) Using the best-fit horizontal half models instead of contact area reduces the error by 15%. (d) Vertical per-participant models reduce the error produced by contact area by 60%.
Figure 19: Lowest-error combinations of half-models
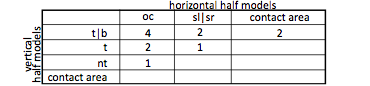
Number of times a combination of half models together produced the best fit for a participant.
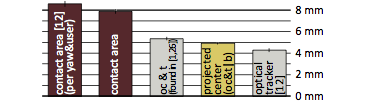
Figure 20: Error produced by full models
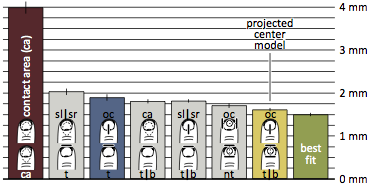
Remaining offset for the full models from Figure 19 compared to contact area model (+/- std. error of the mean).
Figure 21: Engineering results: minimum button sizes
Results from this study in contrast to results of our previous studies.