Glabella: Continuously Sensing Blood Pressure Behavior using an Unobtrusive Wearable Device
Christian Holz. IMWUT 2017. Distinguished paper award.
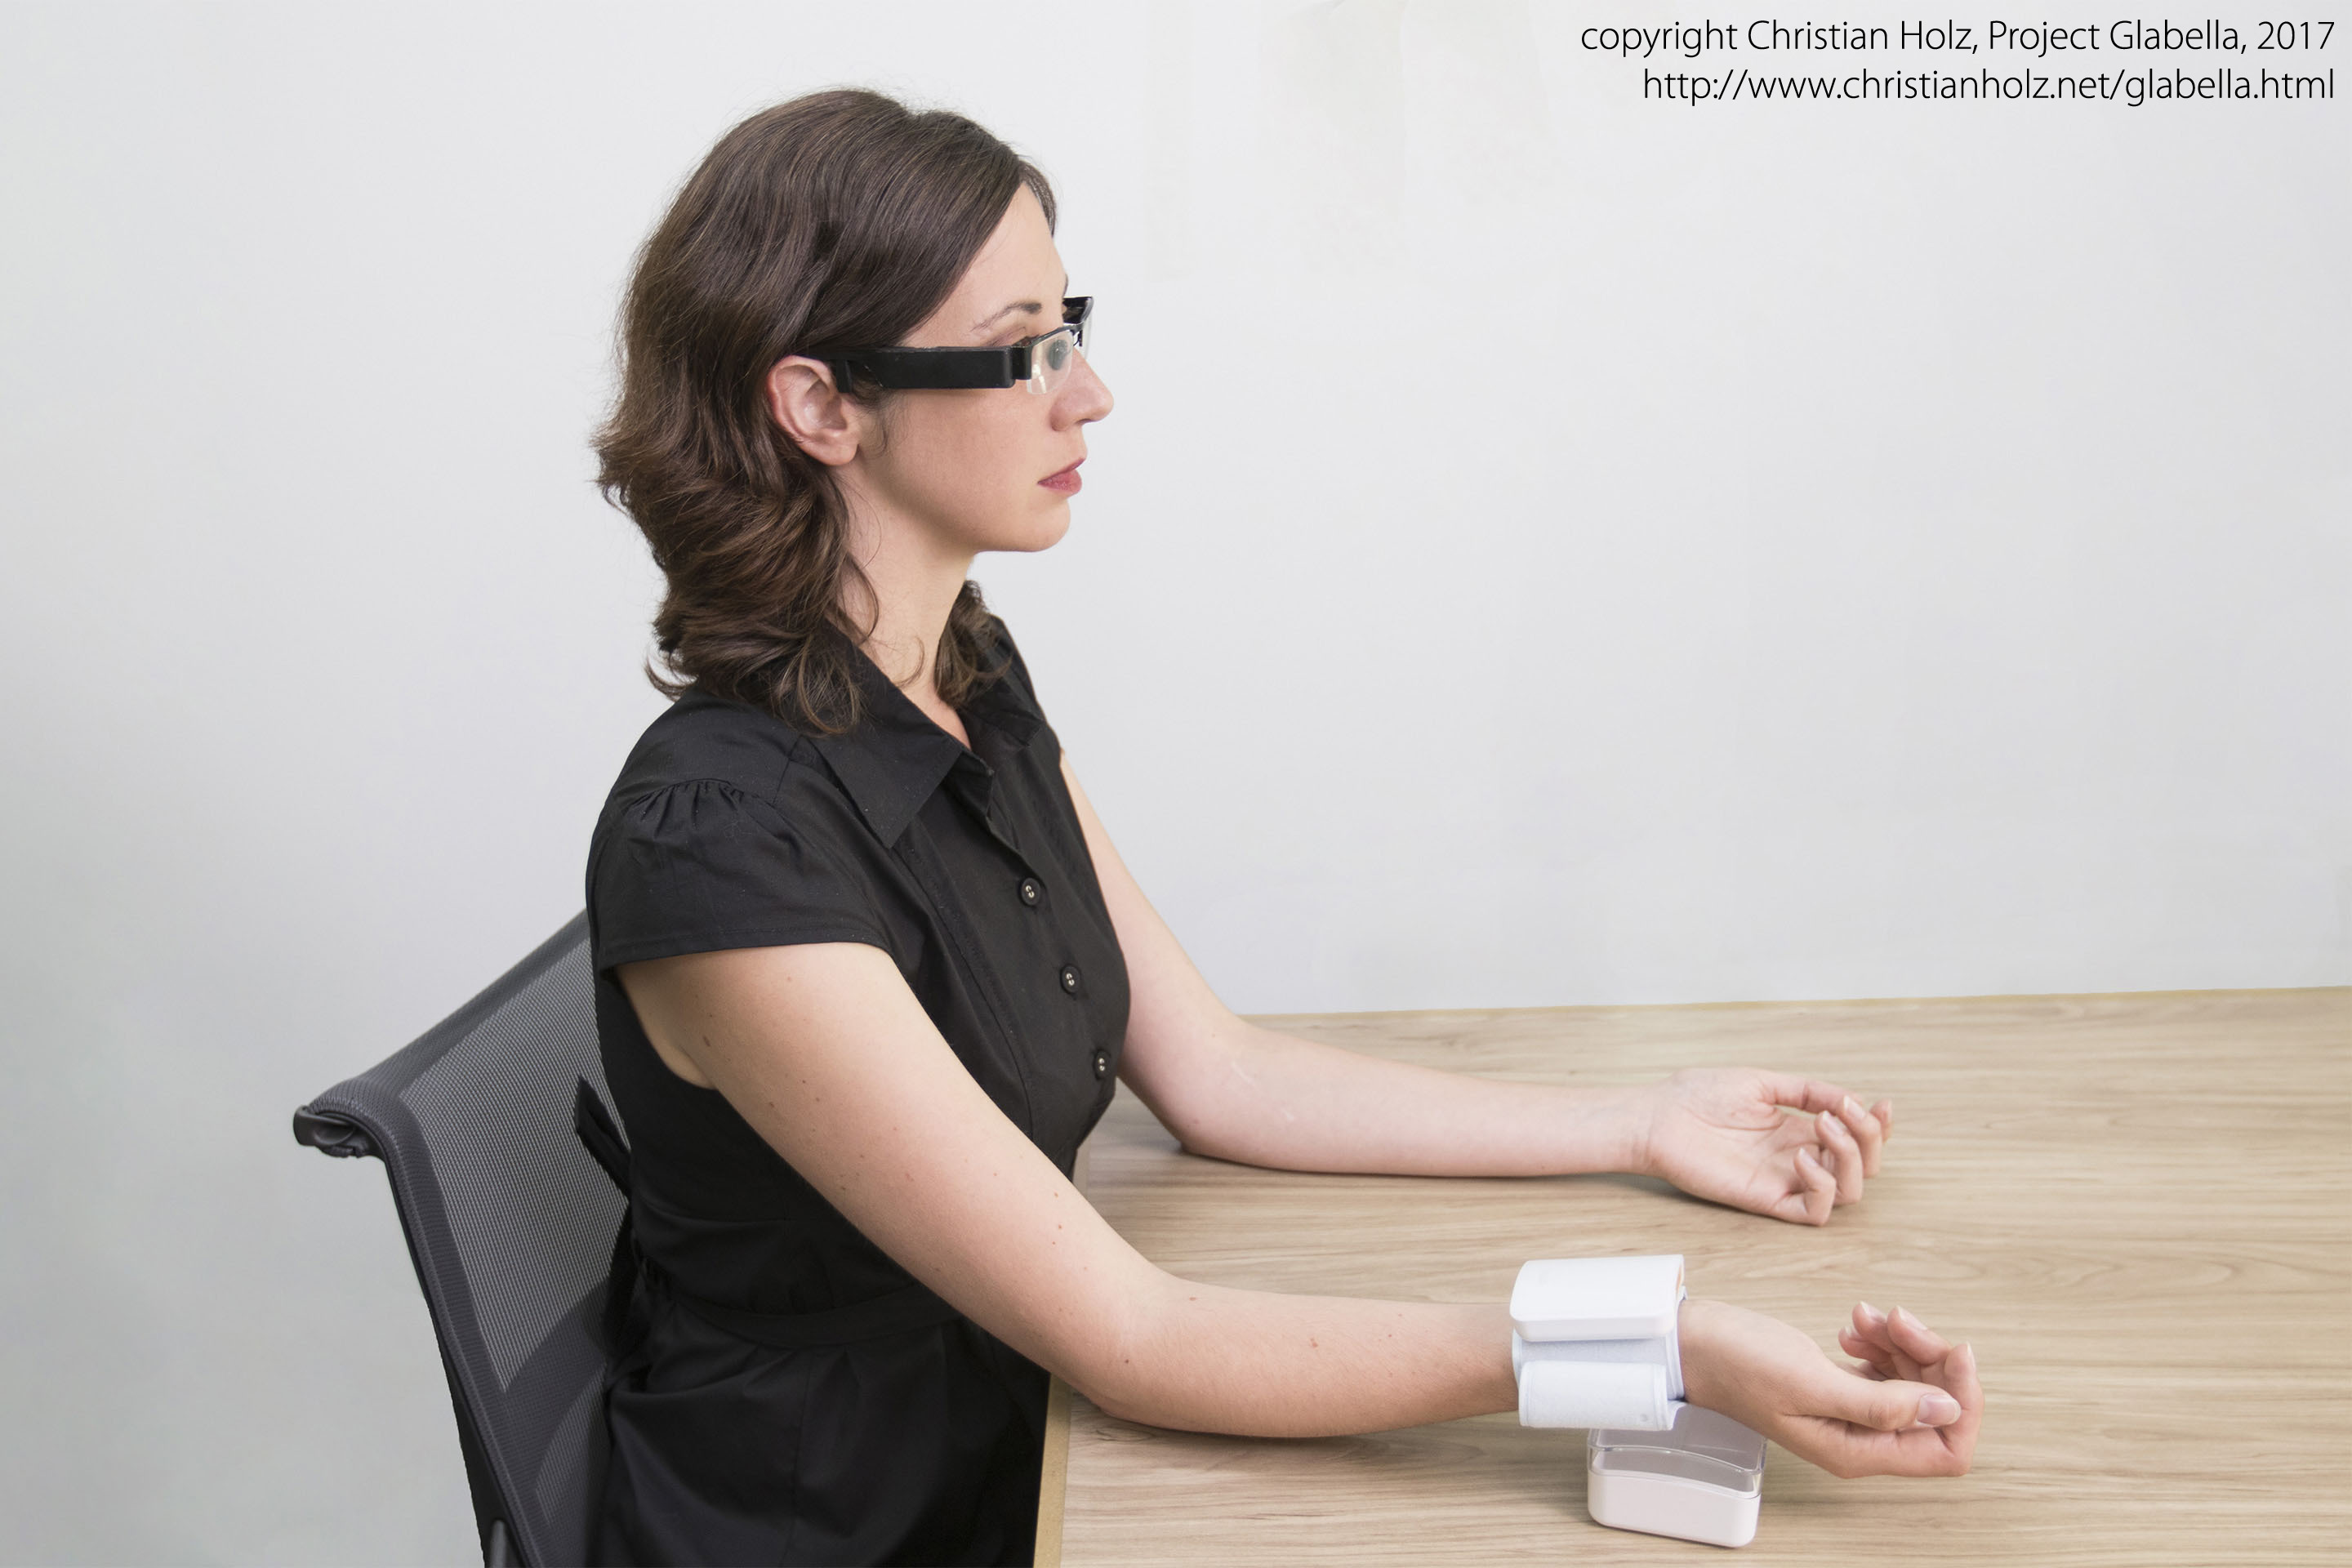
Figure 1
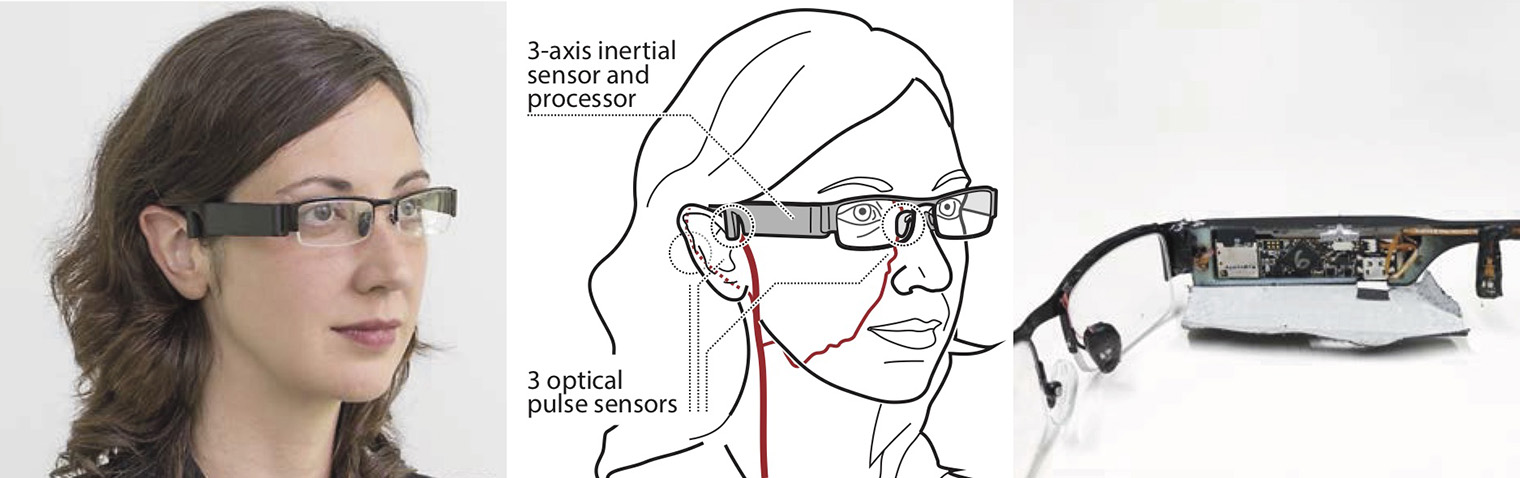
Our wearable glasses prototype Glabella incorporates optical sensors to continuously measure and store the user's pulse waves at three different sites on their face. Our device additionally comprises inertial sensors and a processing unit that compares the continuously recorded pulse waves to extract the user's pulse transit time—the delay between the moments at which the blood ejected from the heart reaches the three sites. Pulse transit time functions as a proxy measurement to monitor the short-term behavior of the user's systolic blood pressure, to which our evaluation shows a significant correlation during in-the-wild use.
Abstract
We propose Glabella, a wearable device that continuously and unobtrusively monitors heart rates at three sites on the wearer's head. Our glasses prototype incorporates optical sensors, processing, storage, and communication components, all integrated into the frame to passively collect physiological data about the user without the need for any interaction. Glabella continuously records the stream of reflected light intensities from blood flow as well as inertial measurements of the user's head. From the temporal differences in pulse events across the sensors, our prototype derives the wearer's pulse transit time on a beat-to-beat basis.
Numerous efforts have found a significant correlation between a person's pulse transit time and their systolic blood pressure. In this paper, we leverage this insight to continuously observe pulse transit time as a proxy for the behavior of systolic blood pressure levels—at a substantially higher level of convenience and higher rate than traditional blood pressure monitors, such as cuff-based oscillometric devices. This enables our cuff-less prototype to model the beat-to-beat fluctuations in the user's blood pressure over the course of the day and record its short-term responses to events, such as postural changes, exercise, eating and drinking, resting, medication intake, location changes, or time of day.
During our in-the-wild evaluation, four participants wore a custom-fit Glabella prototype device over the course of five days throughout their daytime job and regular activities. Participants additionally measured their radial blood pressure three times an hour using a commercial oscillometric cuff. Our analysis shows a high correlation between the pulse transit times computed on our devices with participants’ heart rates (mean r = 0.92, SE = 0.03, angular artery) and systolic blood pressure values measured using the oscillometric cuffs (mean r = 0.79, SE = 0.15, angular–superficial temporal artery, considering participants' self-administered cuff-based measurements as ground truth). Our results indicate that Glabella has the potential to serve as a socially-acceptable capture device, requiring no user input or behavior changes during regular activities, and whose continuous measurements may prove informative to physicians as well as users' self-tracking activities.
Publication
Contributions: Continuous Cuff-less Blood Pressure Monitoring
- A wearable device that continuously records the wearer’s pulse and pulse transit times at a high frequency. Recording the pulse transit time enables the device to predict and monitor the behavior of the wearer’s systolic blood pressure on a beat-by-beat basis throughout the day. The frequent nature of sampling has the potential of helping in detecting short-term anomalies in an individual's blood pressure, such as temporary hypotension and hypertension, response and recovery times to medication, food intake, activity, as well as other events during the day.
- A standalone and socially-acceptable form factor with all components integrated to minimally if at all impact the user’s daily patterns. Users are not required to remember to measure or consciously stop their activities to take a measurement. Our device does not require being semi-permanently attached to or removed from the user's body, such as ECG electrodes.
- An in-the-wild evaluation of our prototype over the course of ve days, during which participants continuously wore a custom-fit Glabella prototype and recorded their heart rate and blood pressure using a commercial cuff-based oscillometric device.
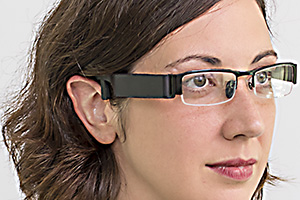
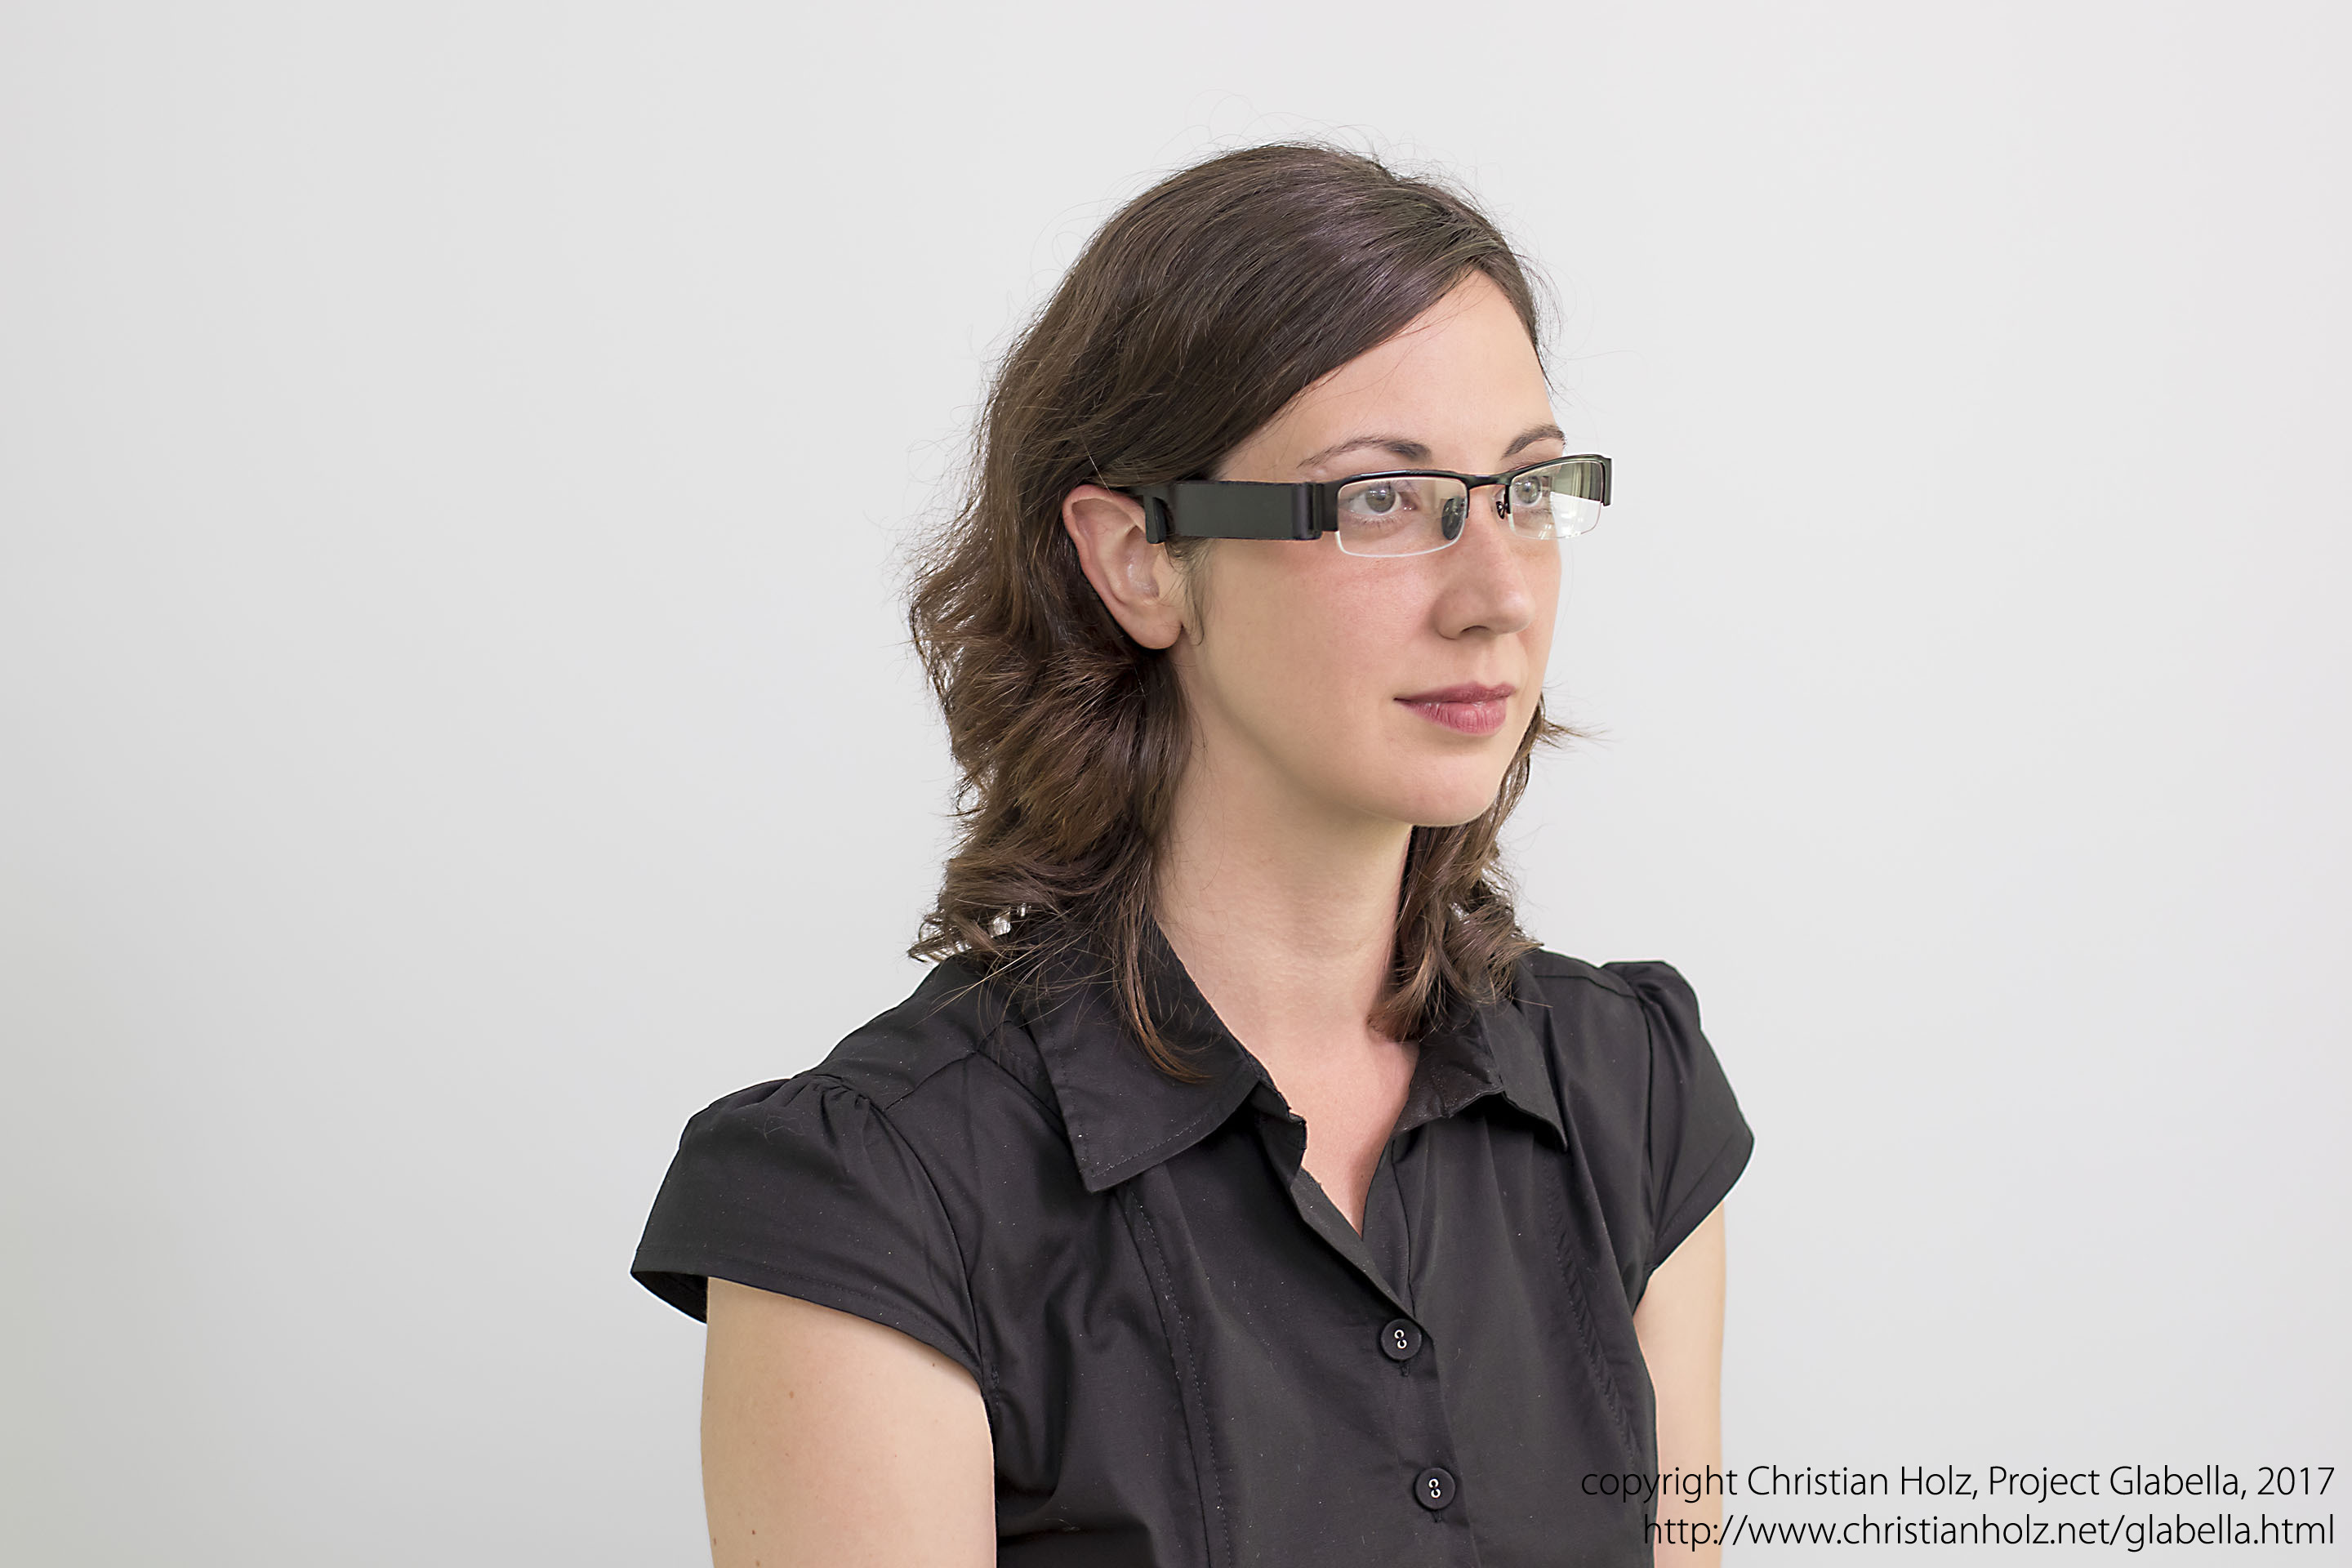
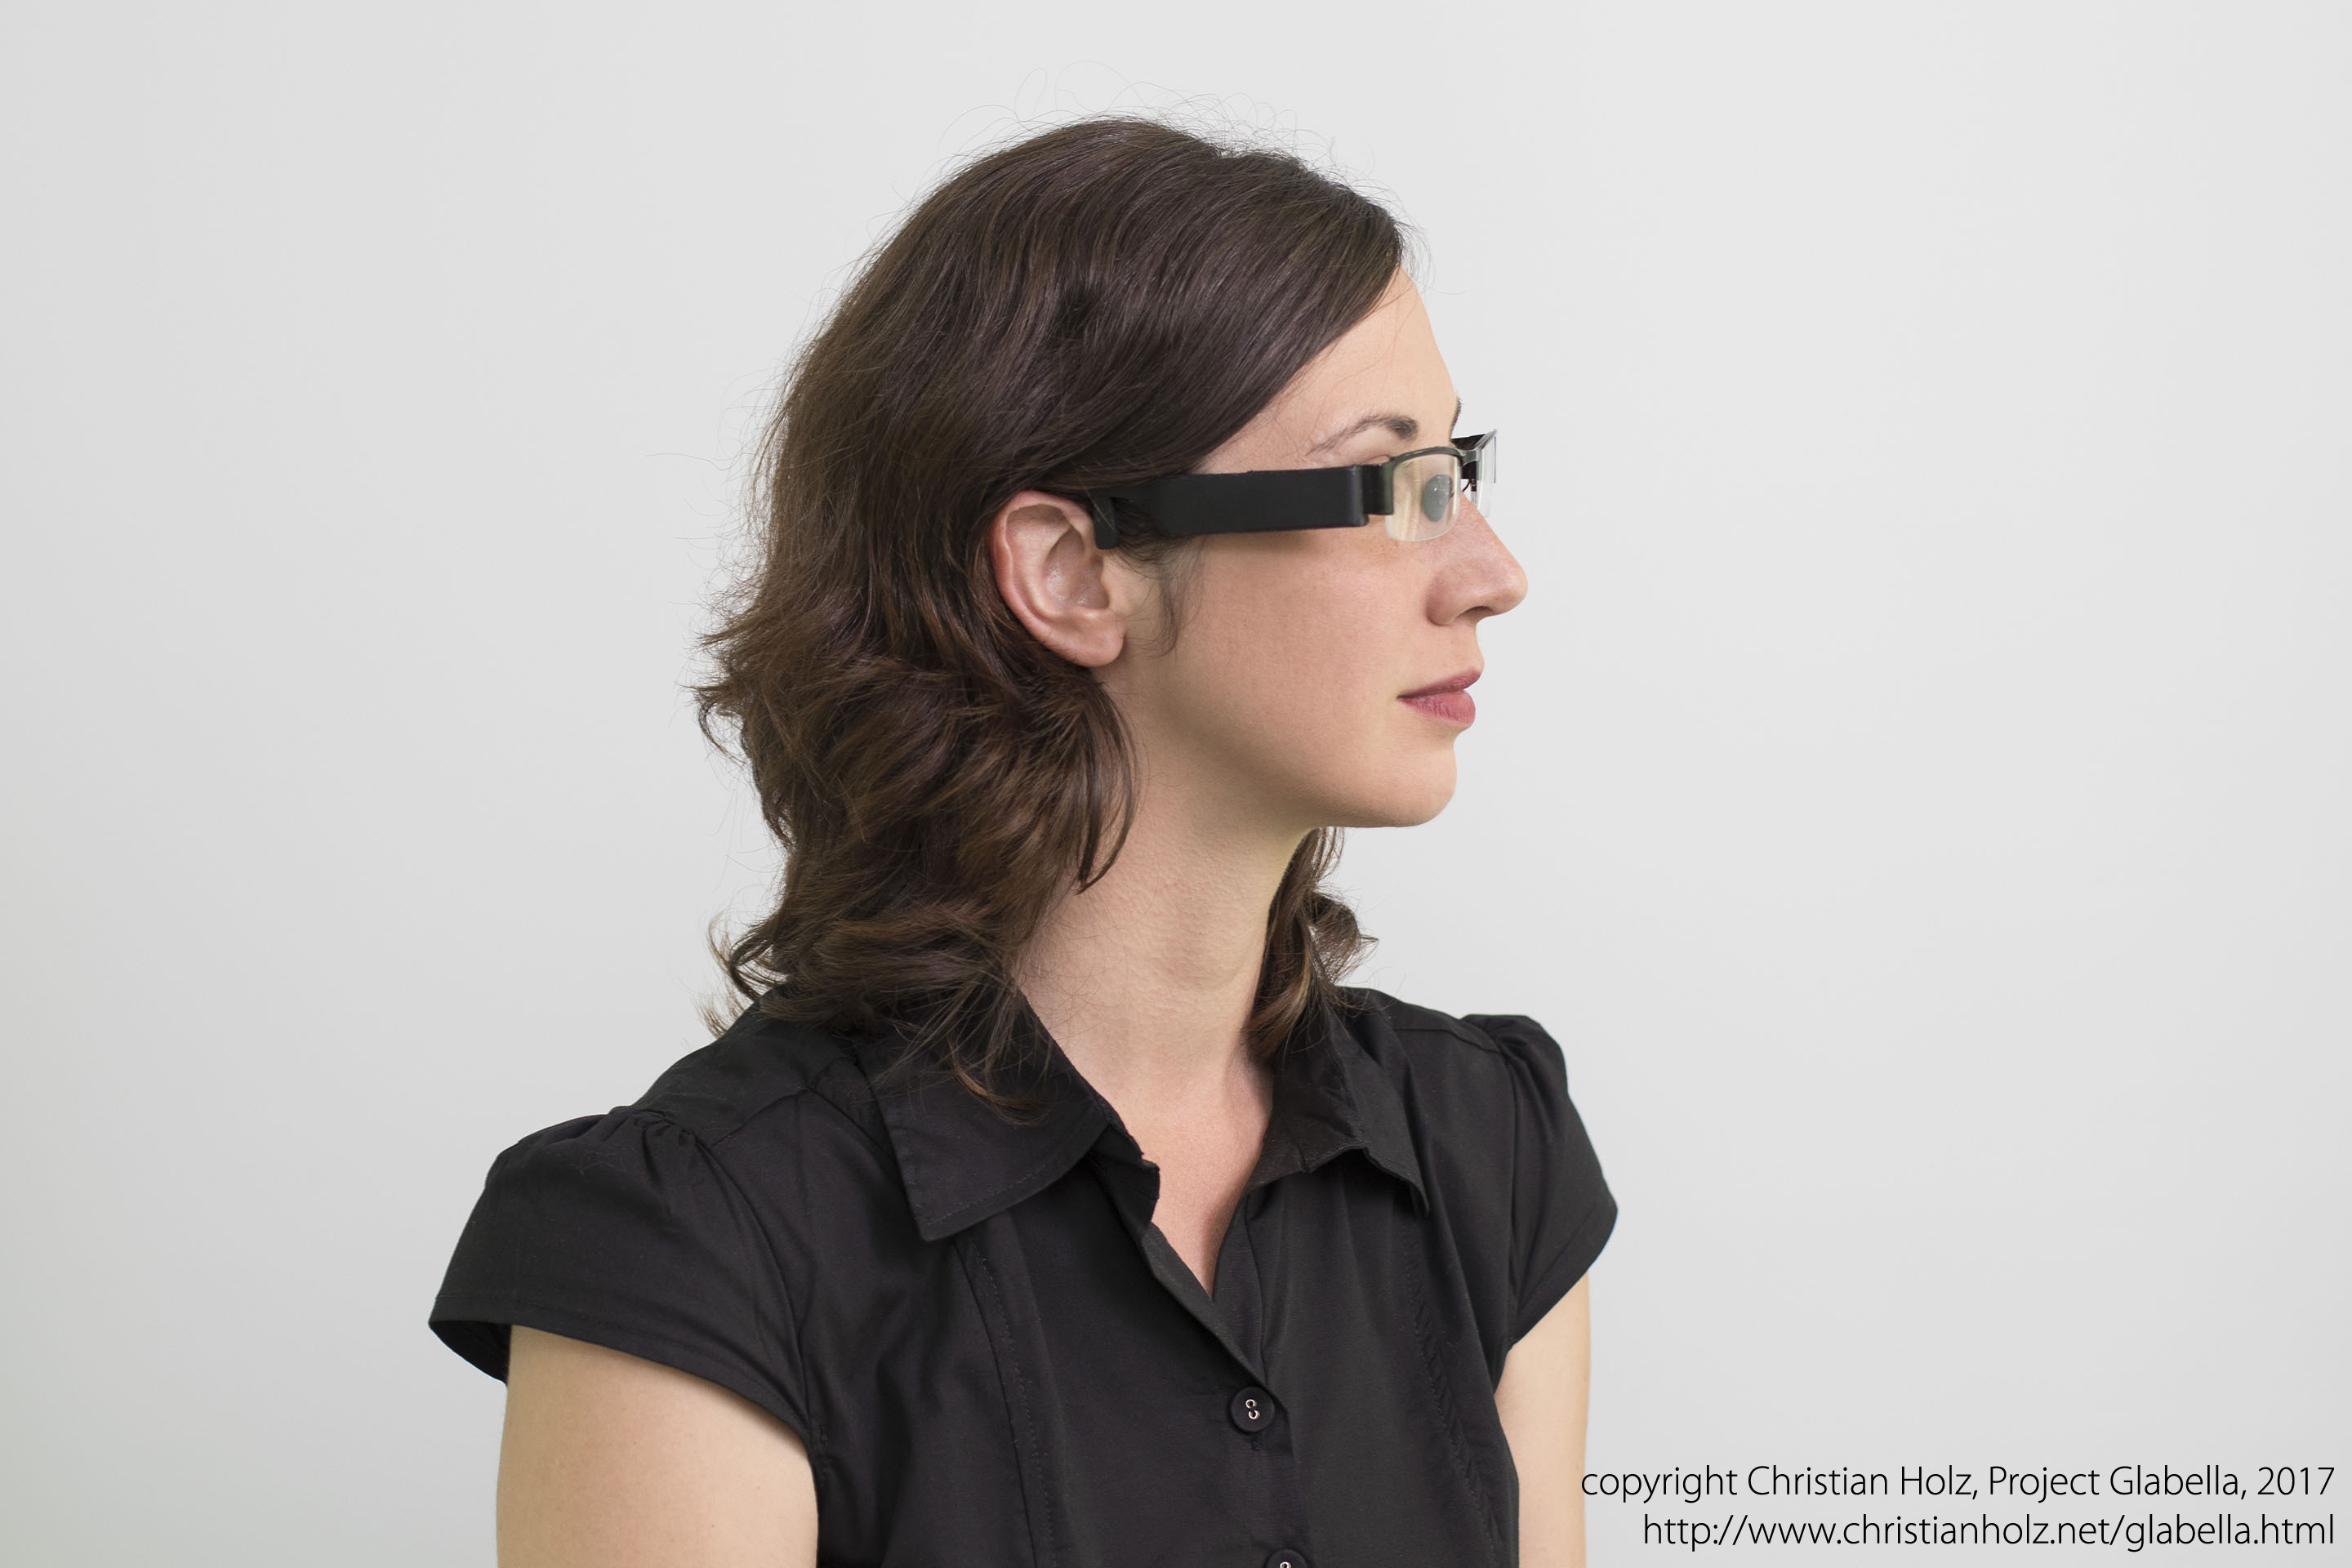
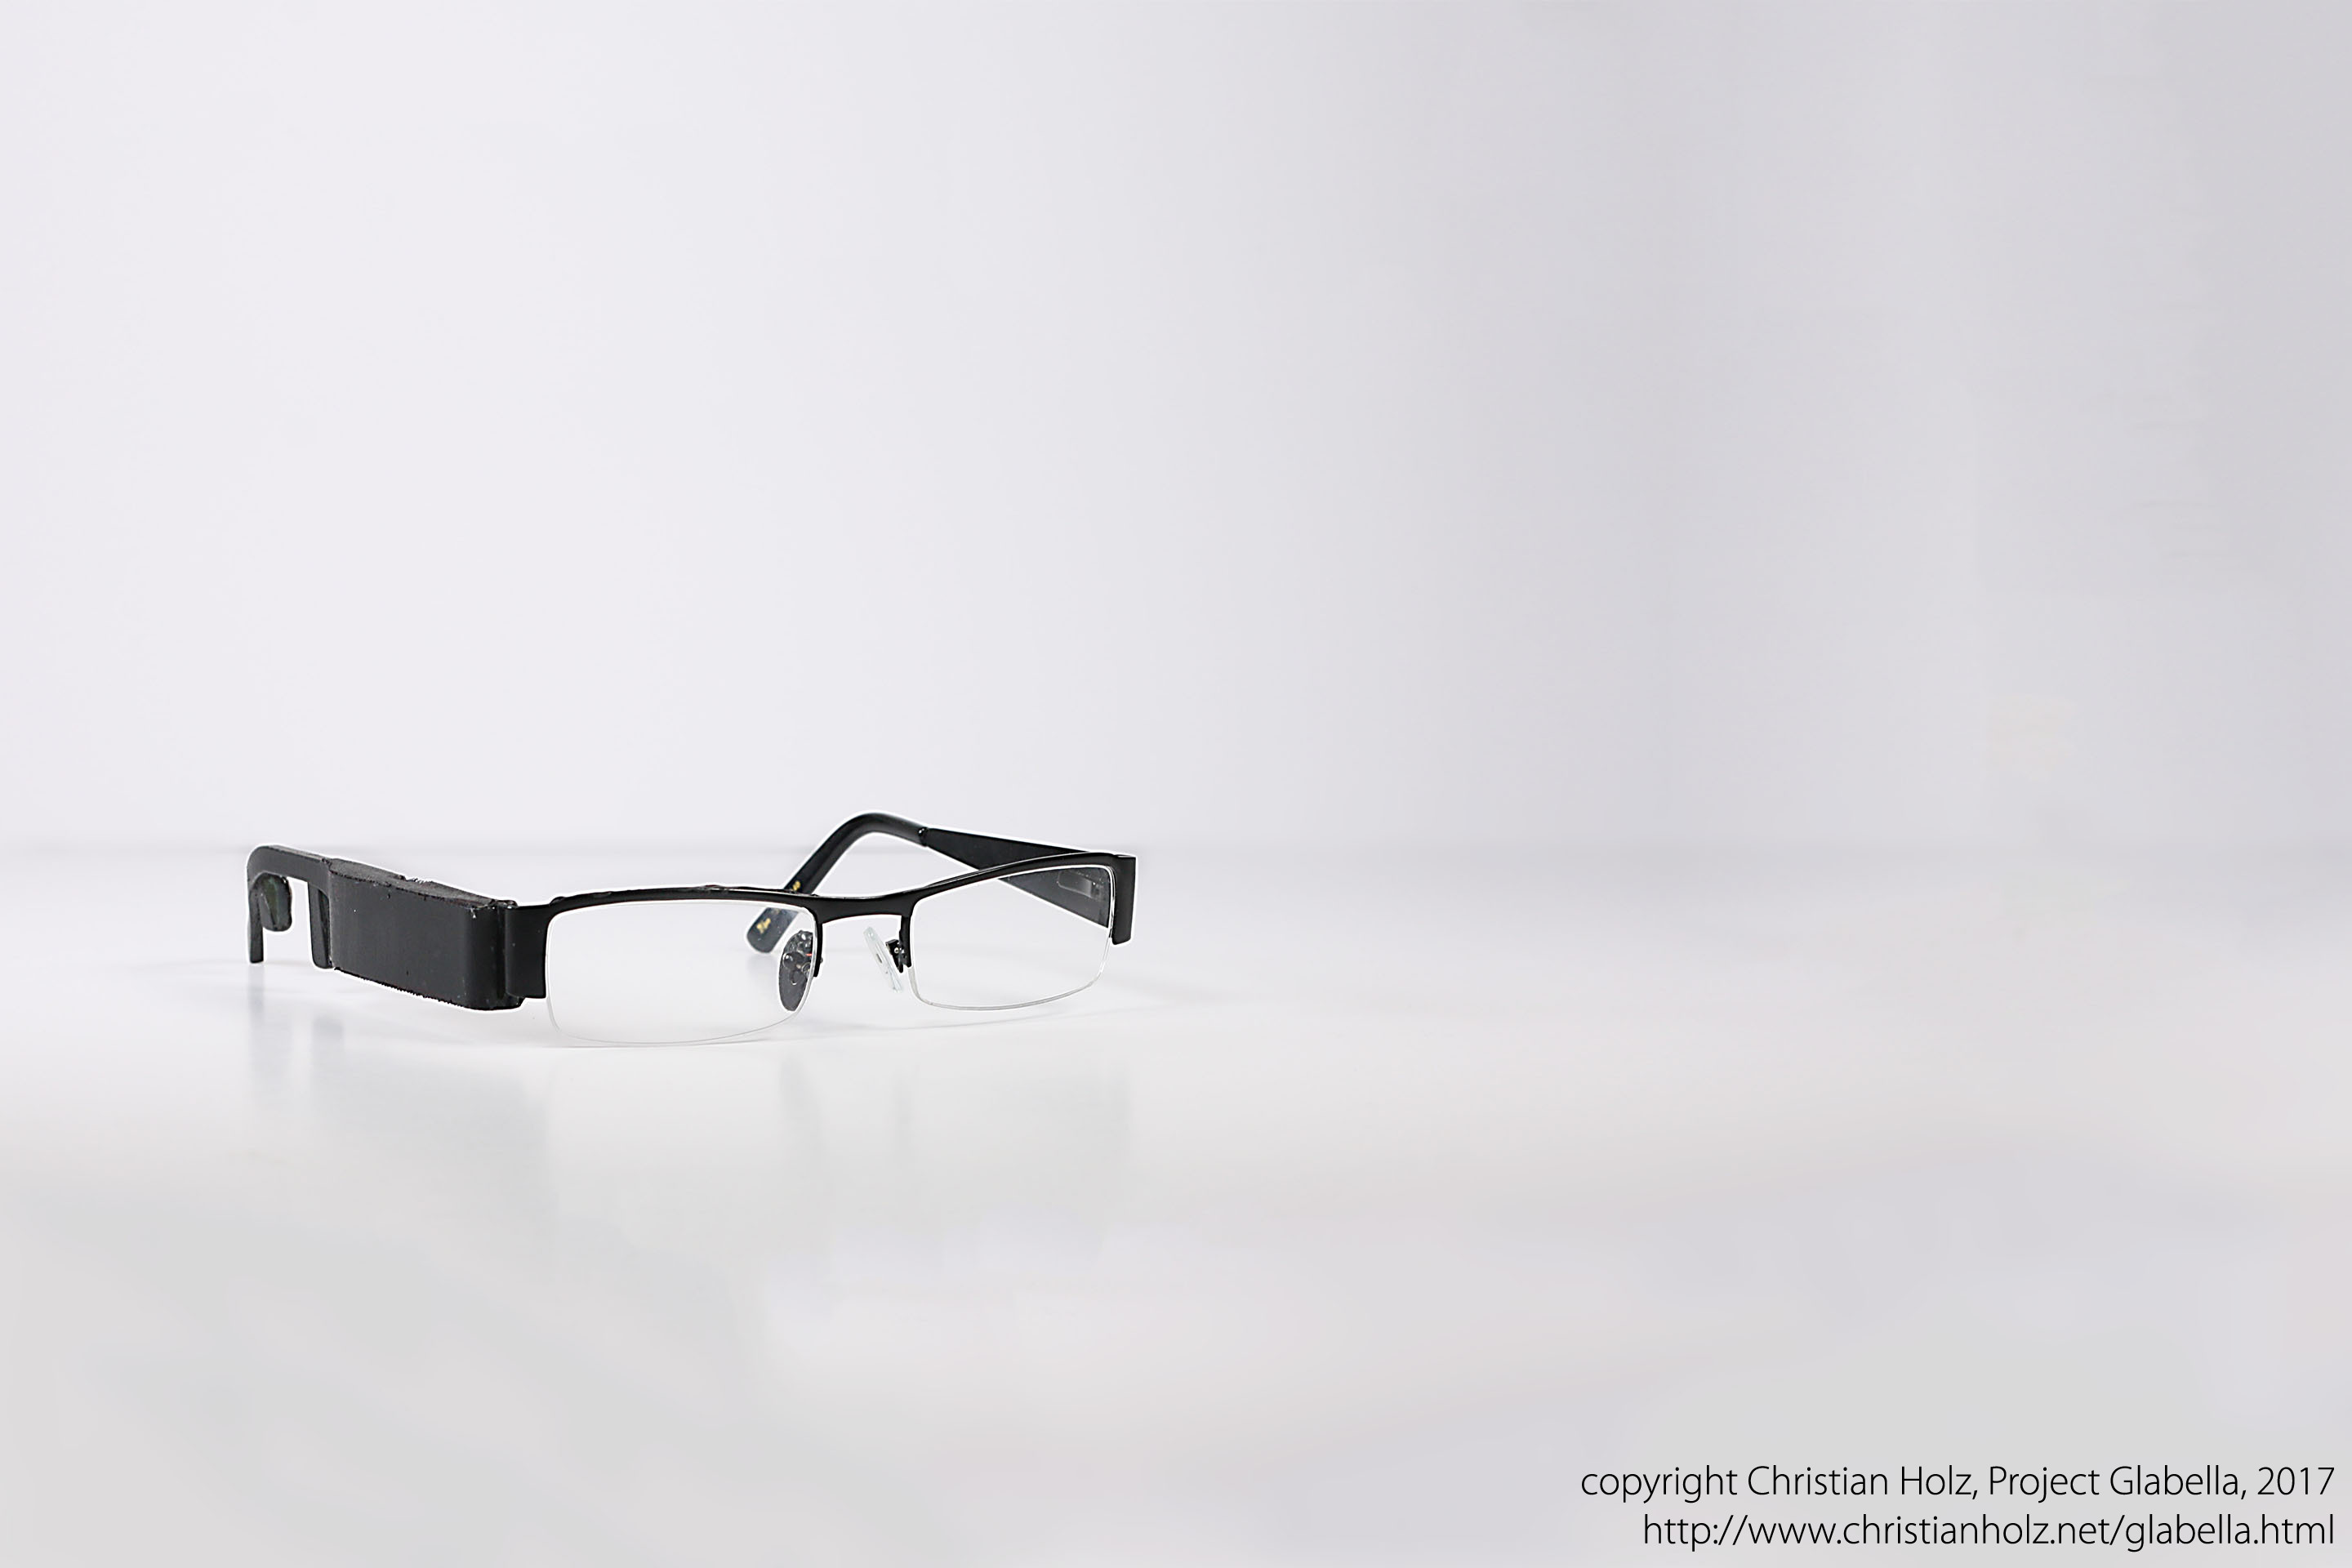
High-resolution photos


Other figures
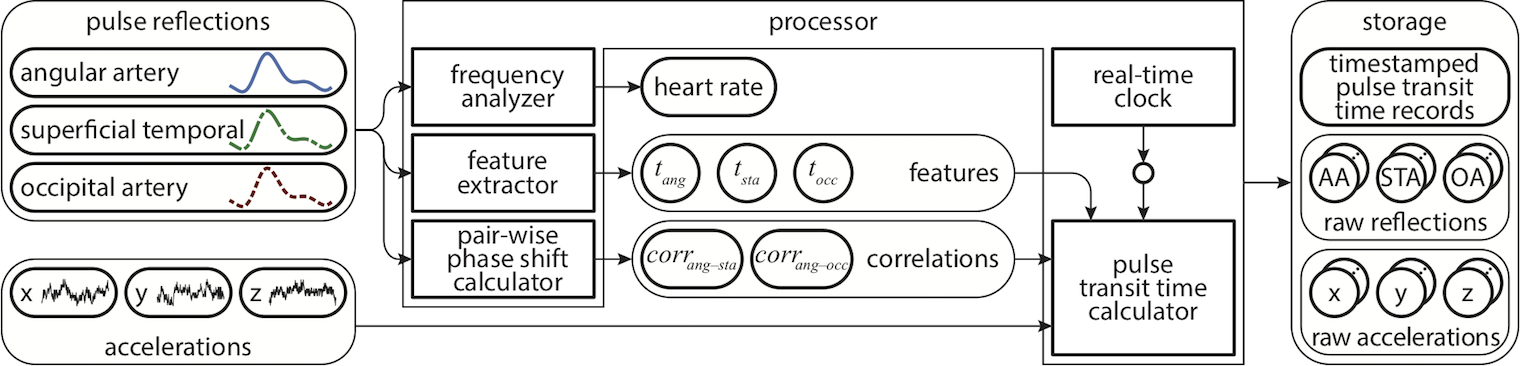
Overview of the wearable platform we built: Each prototype senses the reflections of the wearer's pulse in three locations as well as the 3D inertial motions of the head through the frame. From the input signals, the prototype extracts the wearer’s heart rate and the temporal features in the pulse reflections, from which we calculate the pulse transit time for each beat. Analyzing device motions and the cross-correlation across the reflections allows us to reject inaccurate candidate beats in the raw pulse signals. Finally, Glabella stores the raw signal streams along with the computed features, heart rates, and pulse transit times on an SD card.
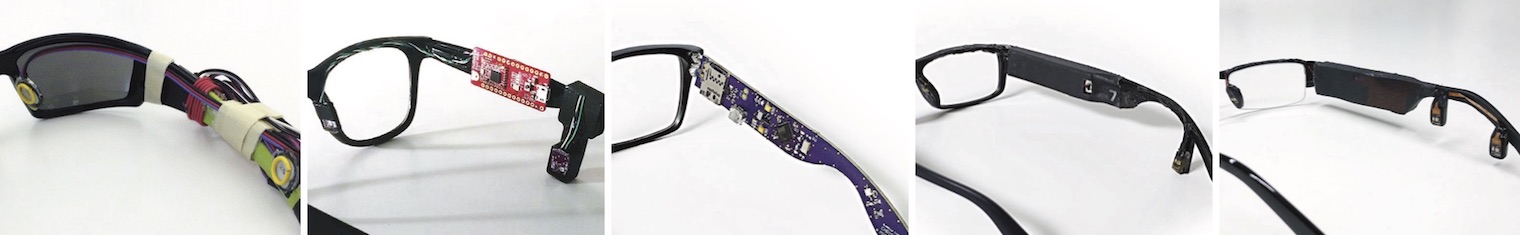
The iterative evolution of our Glabella prototypes. While the first two prototypes consisted of Arduino-based components to study and evaluate the feasibility of our approach in pilots, Versions 3–5 miniaturize the form factor into an integrated device that comprises all components on two separate types of boards: the main board, which sits inside the glasses frame, and the sensor boards that connect through flex PCB cables.
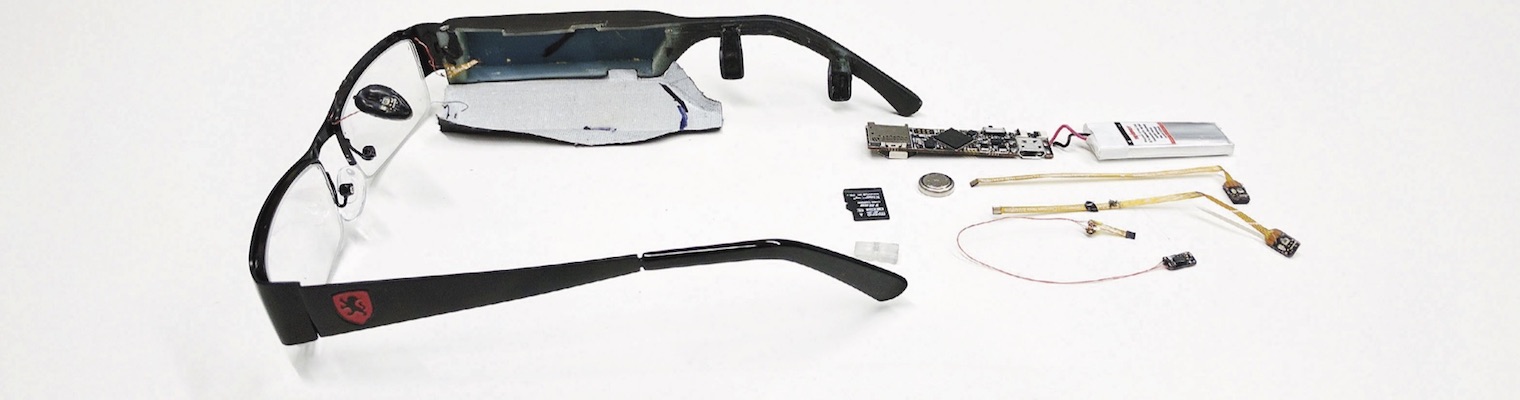
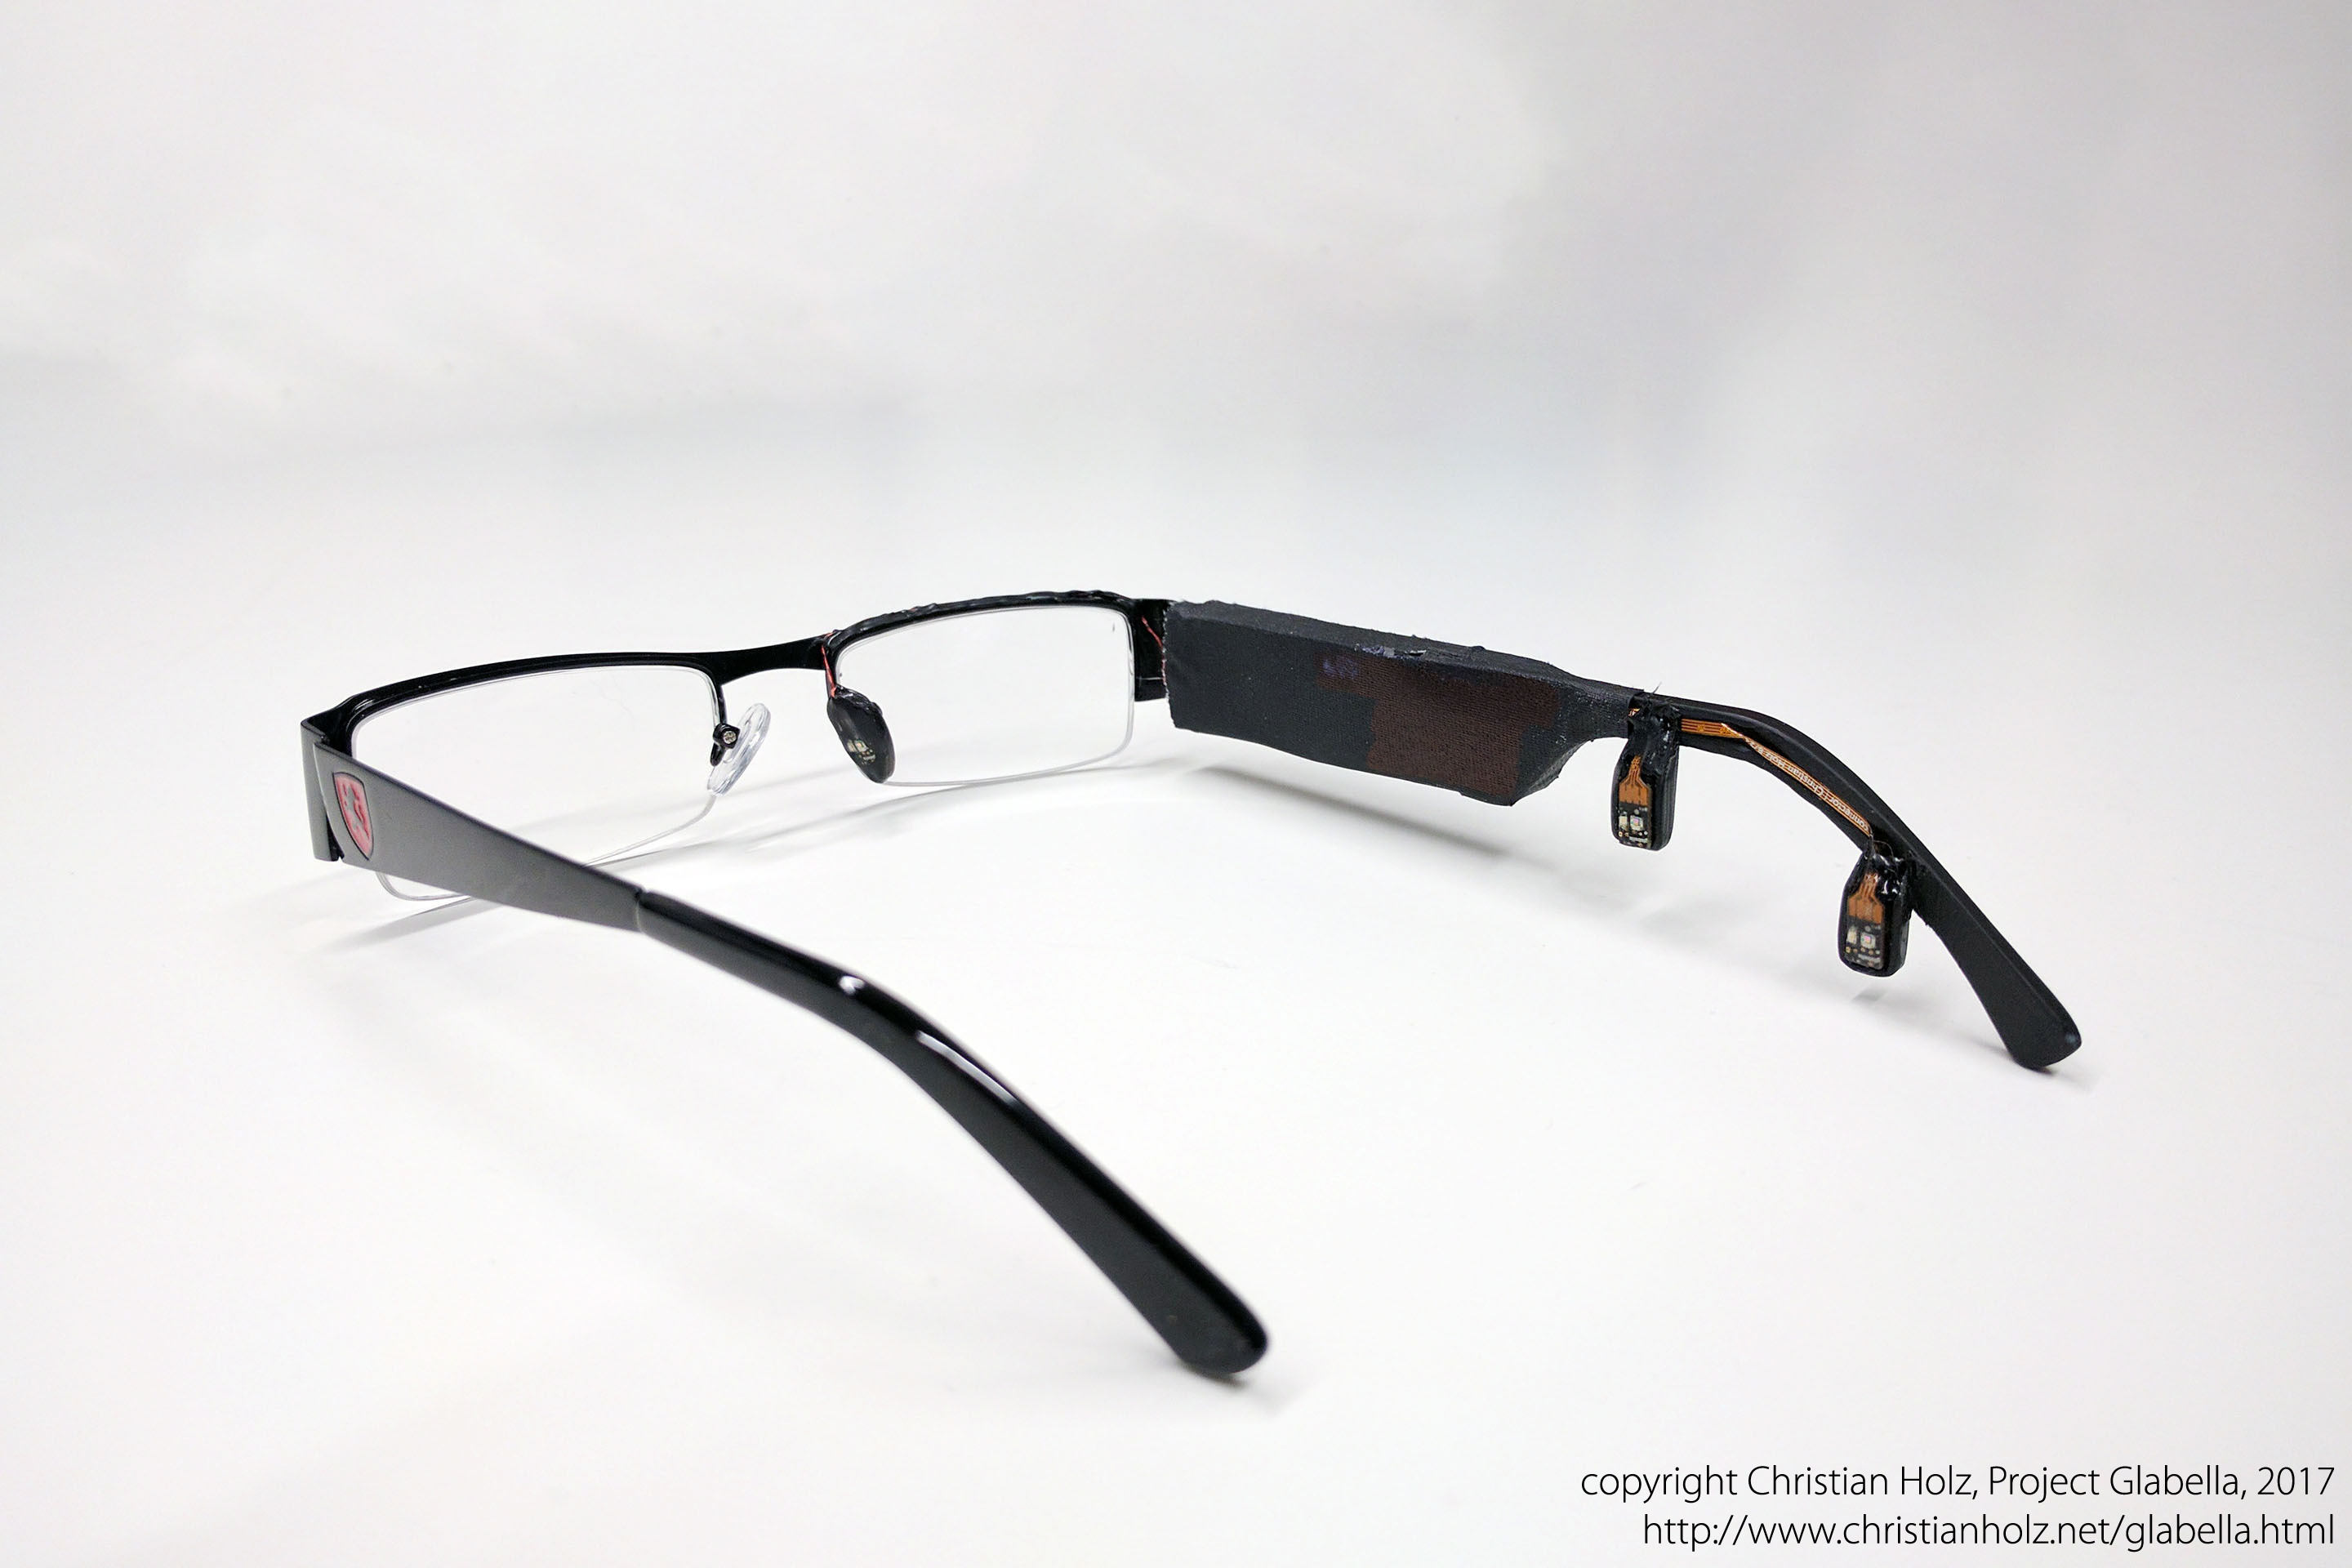
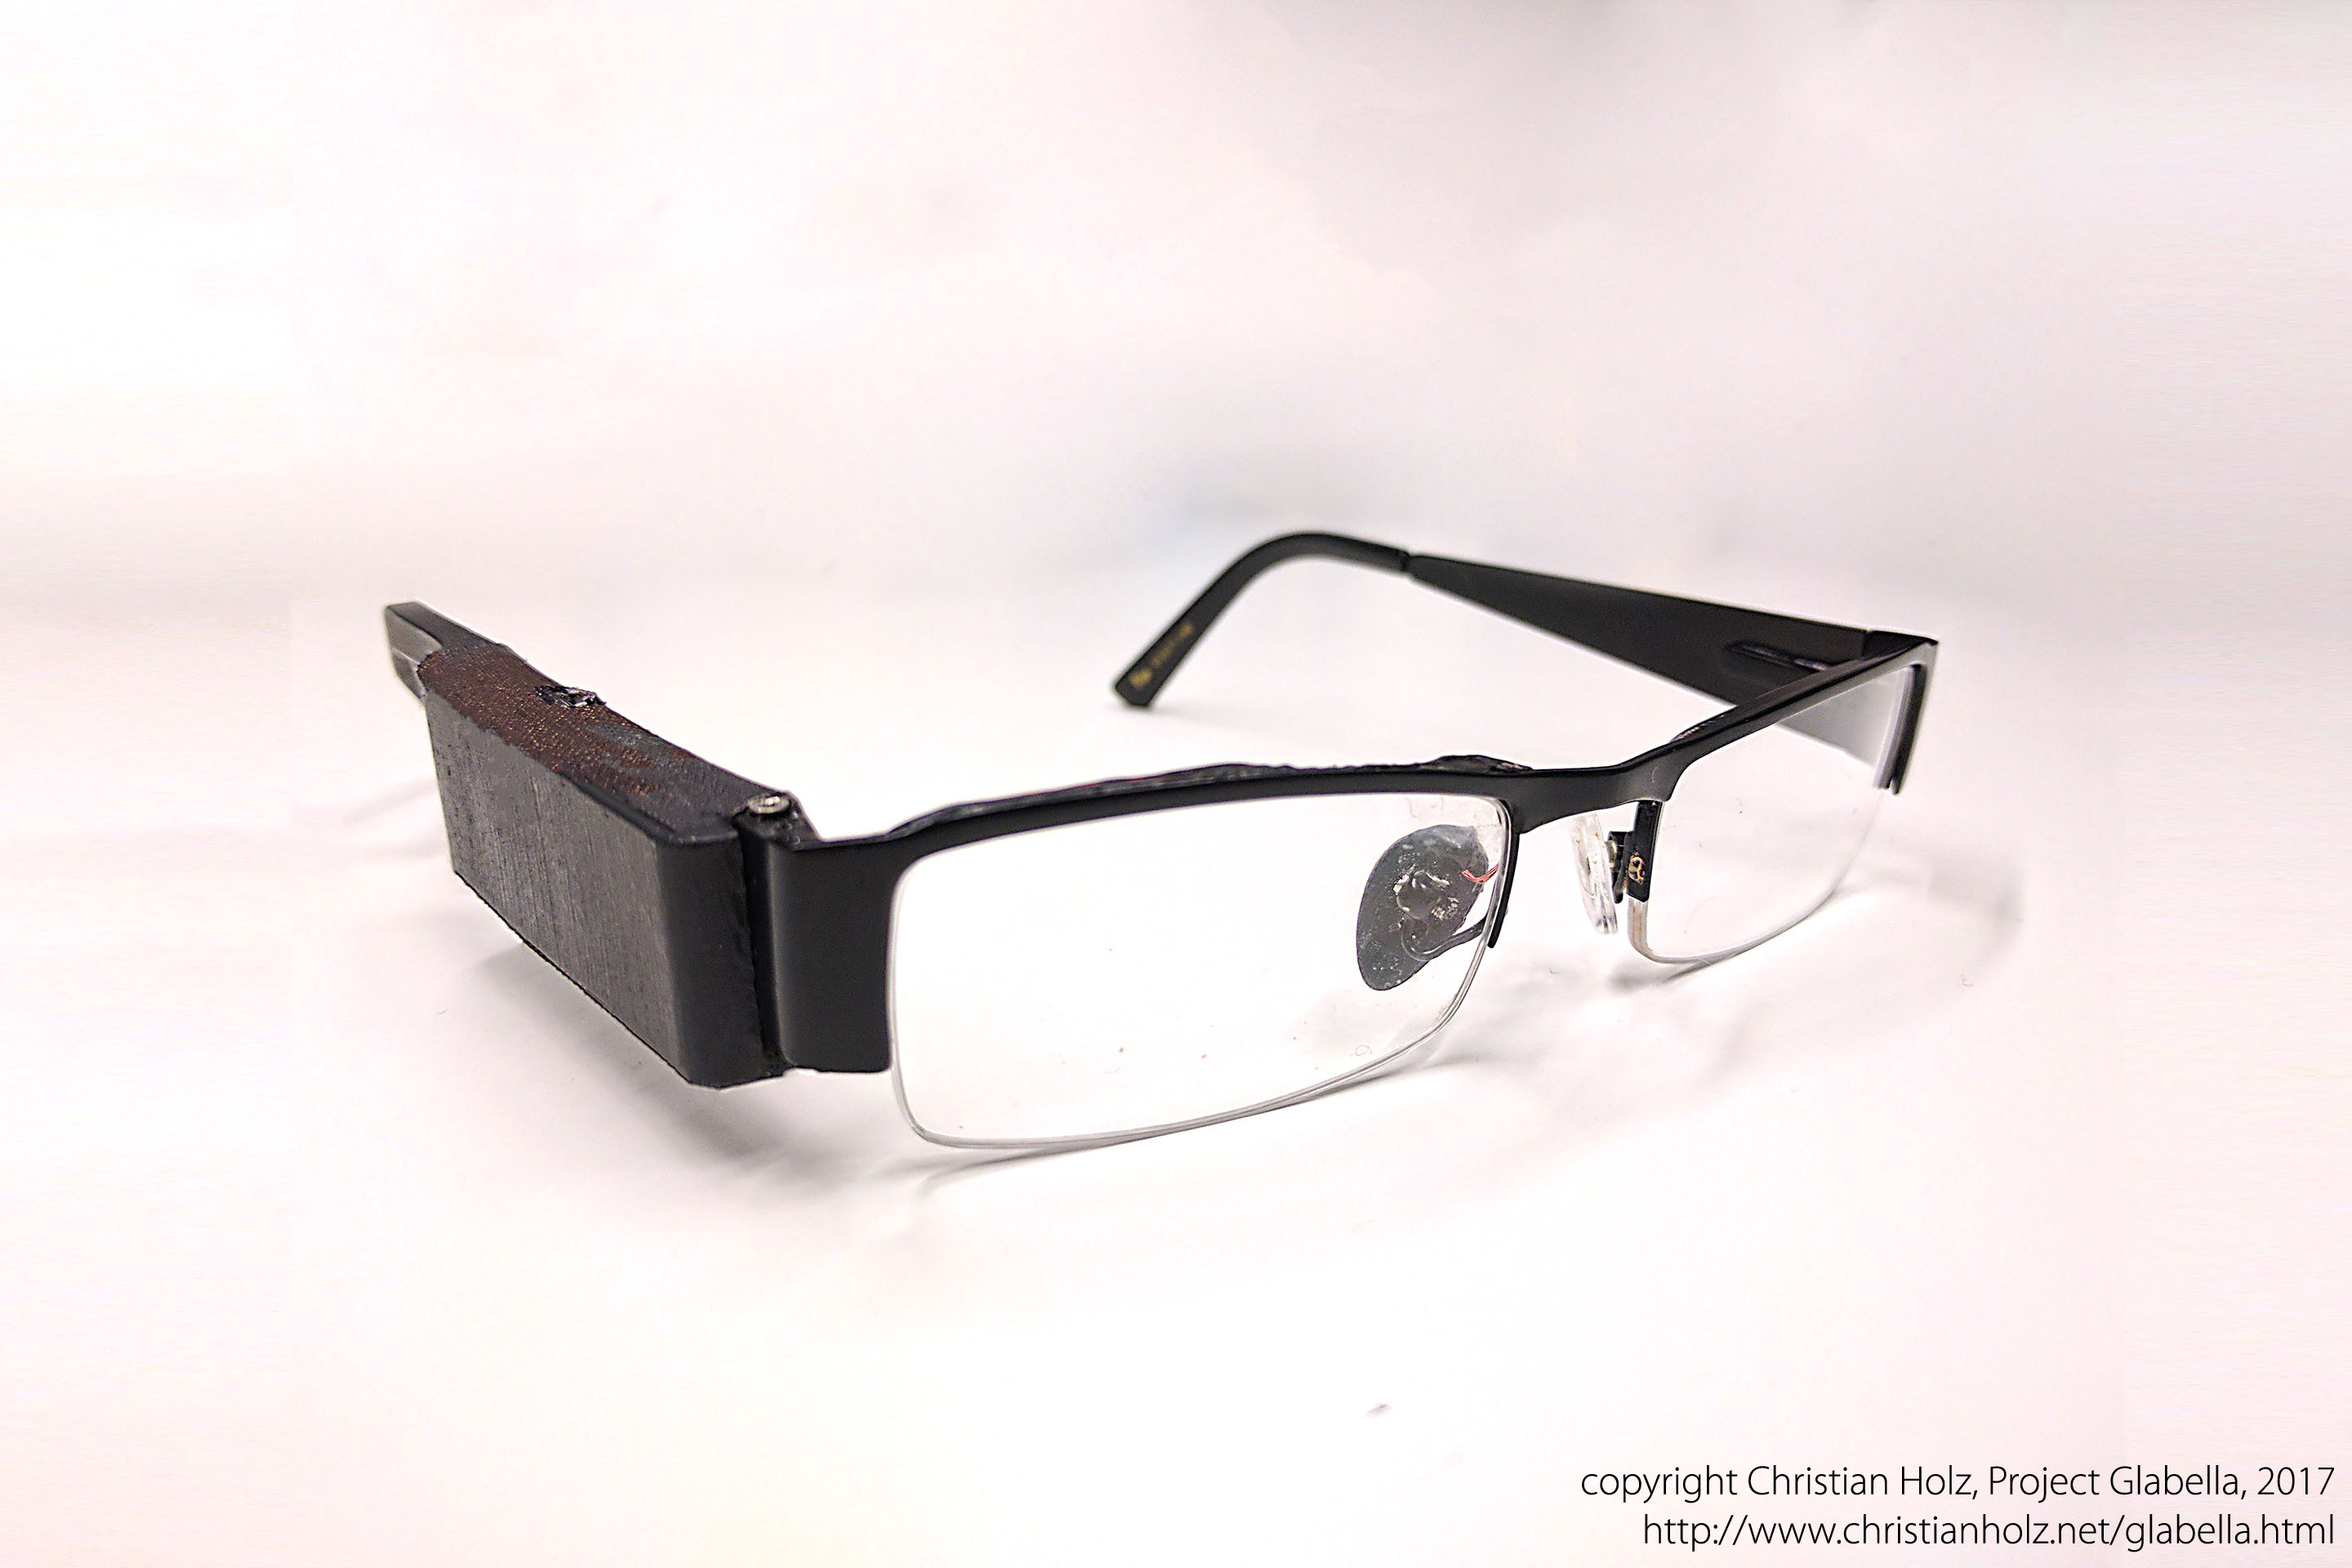
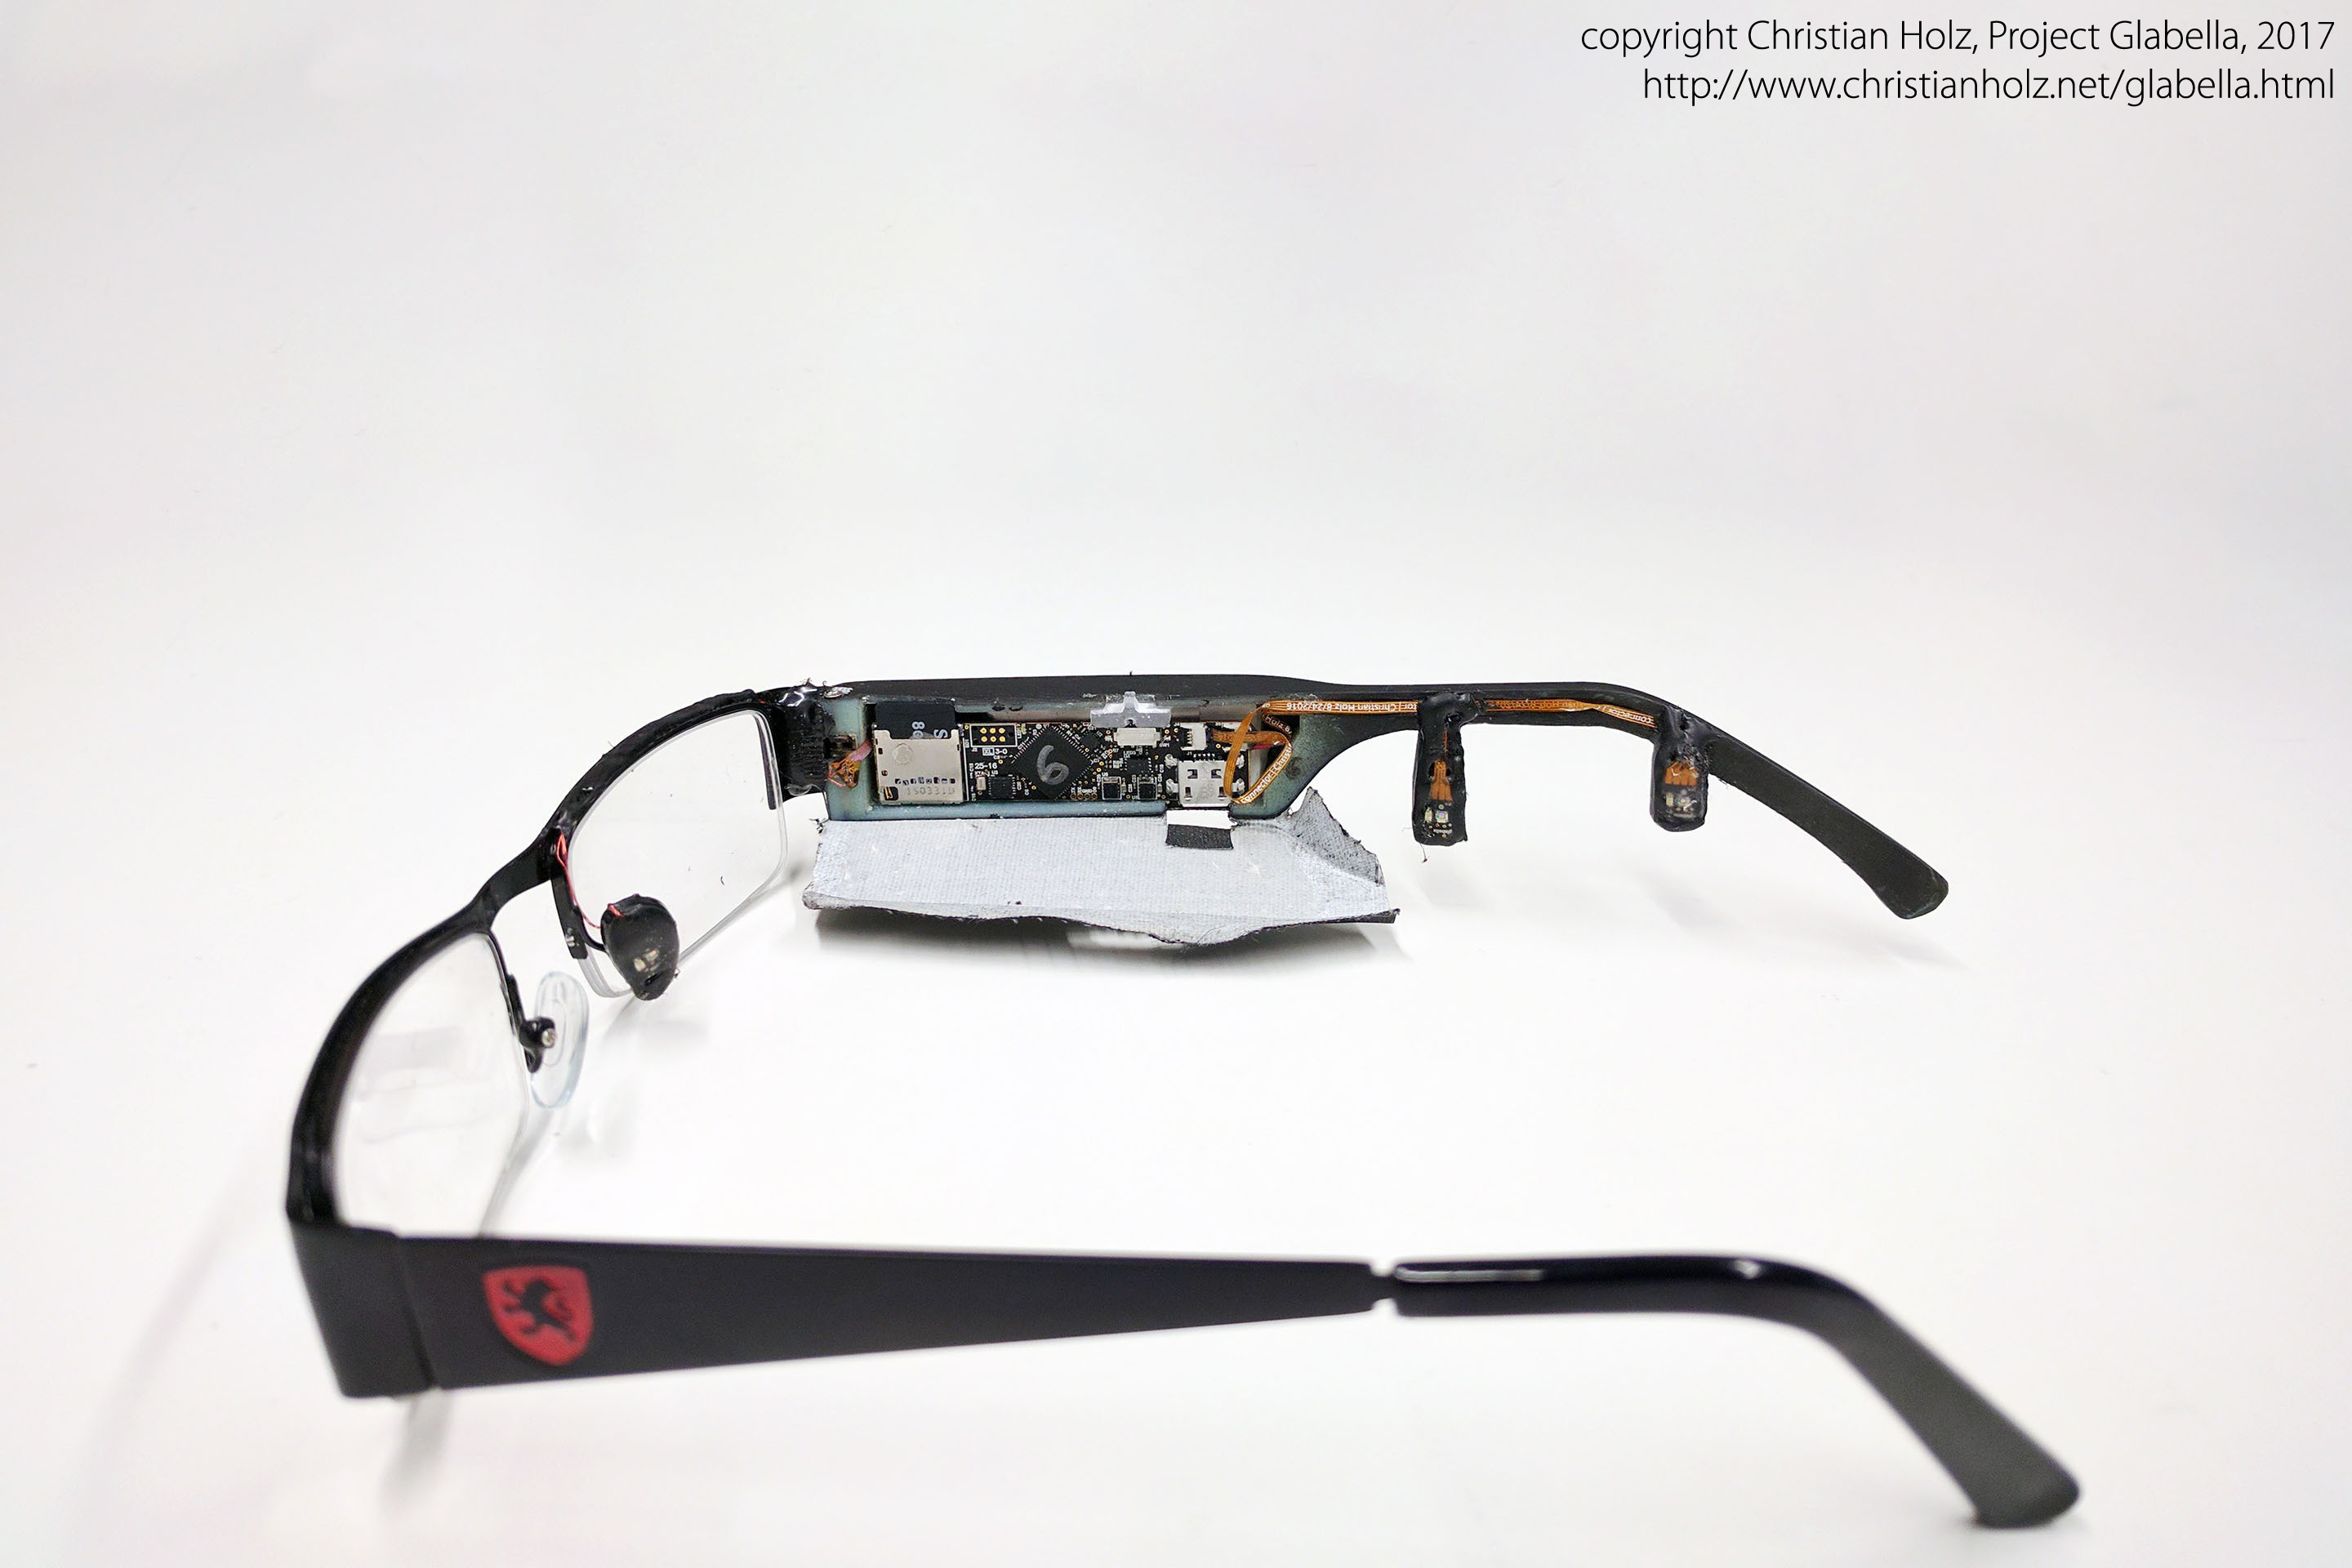
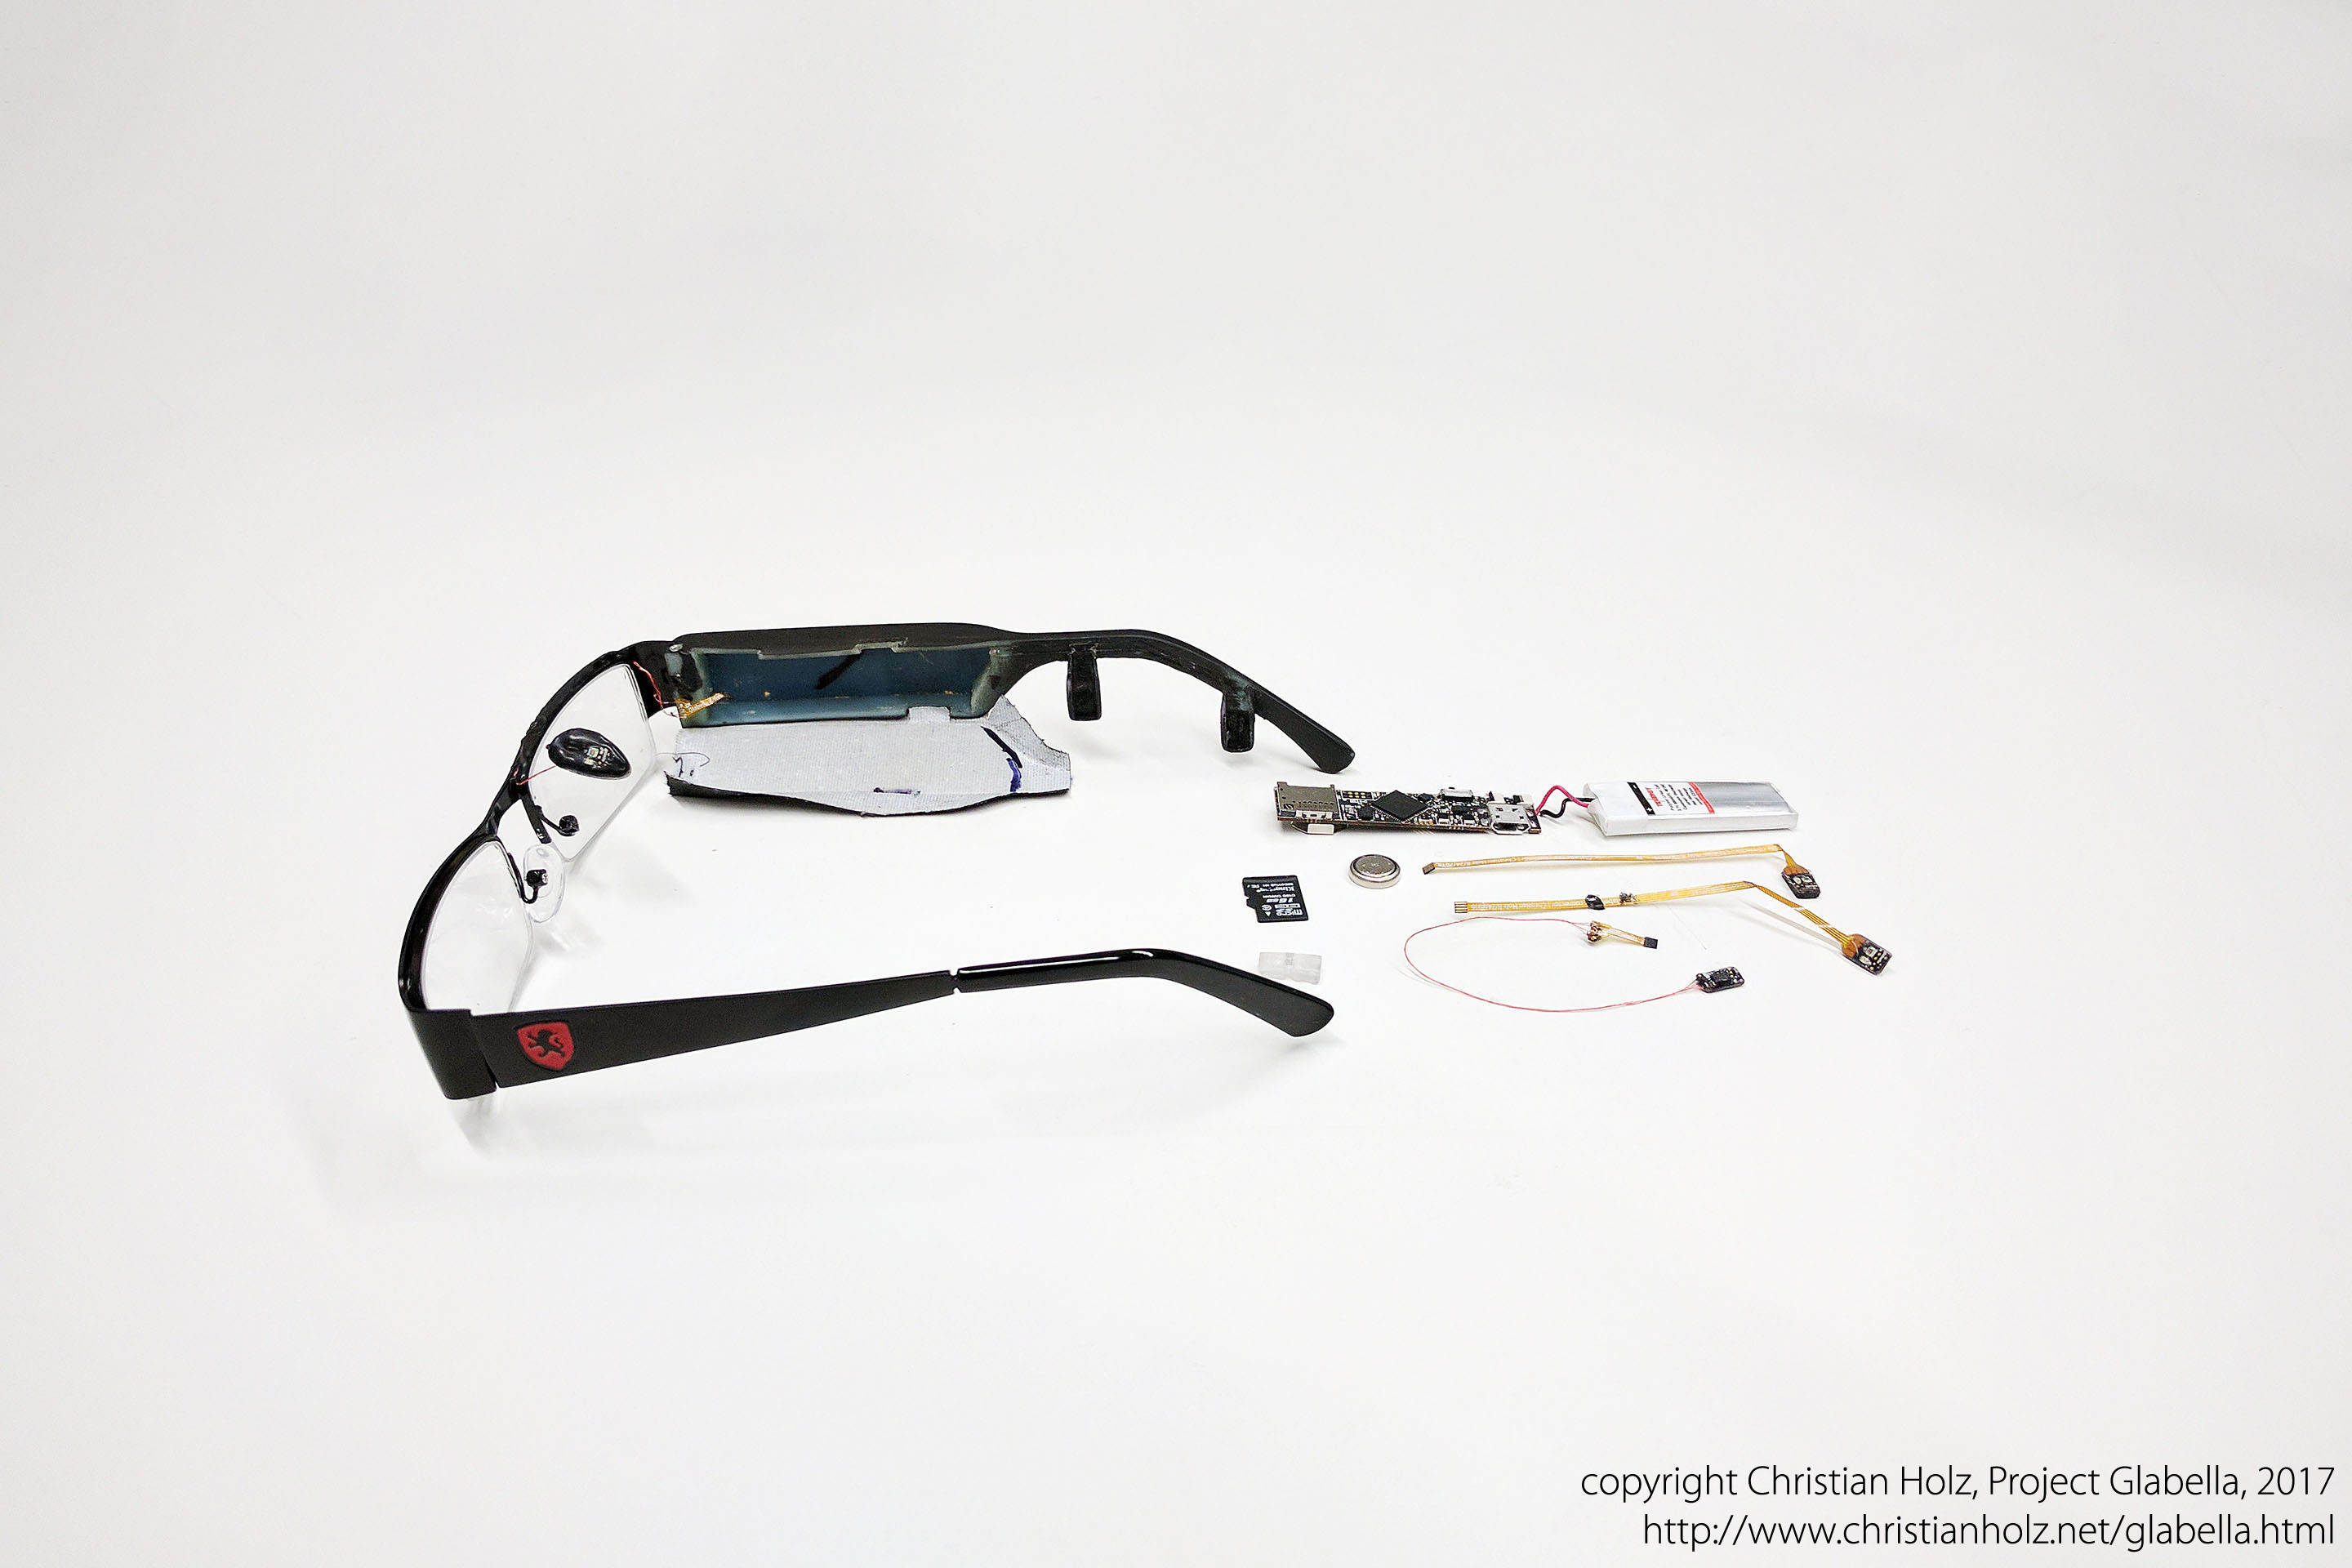
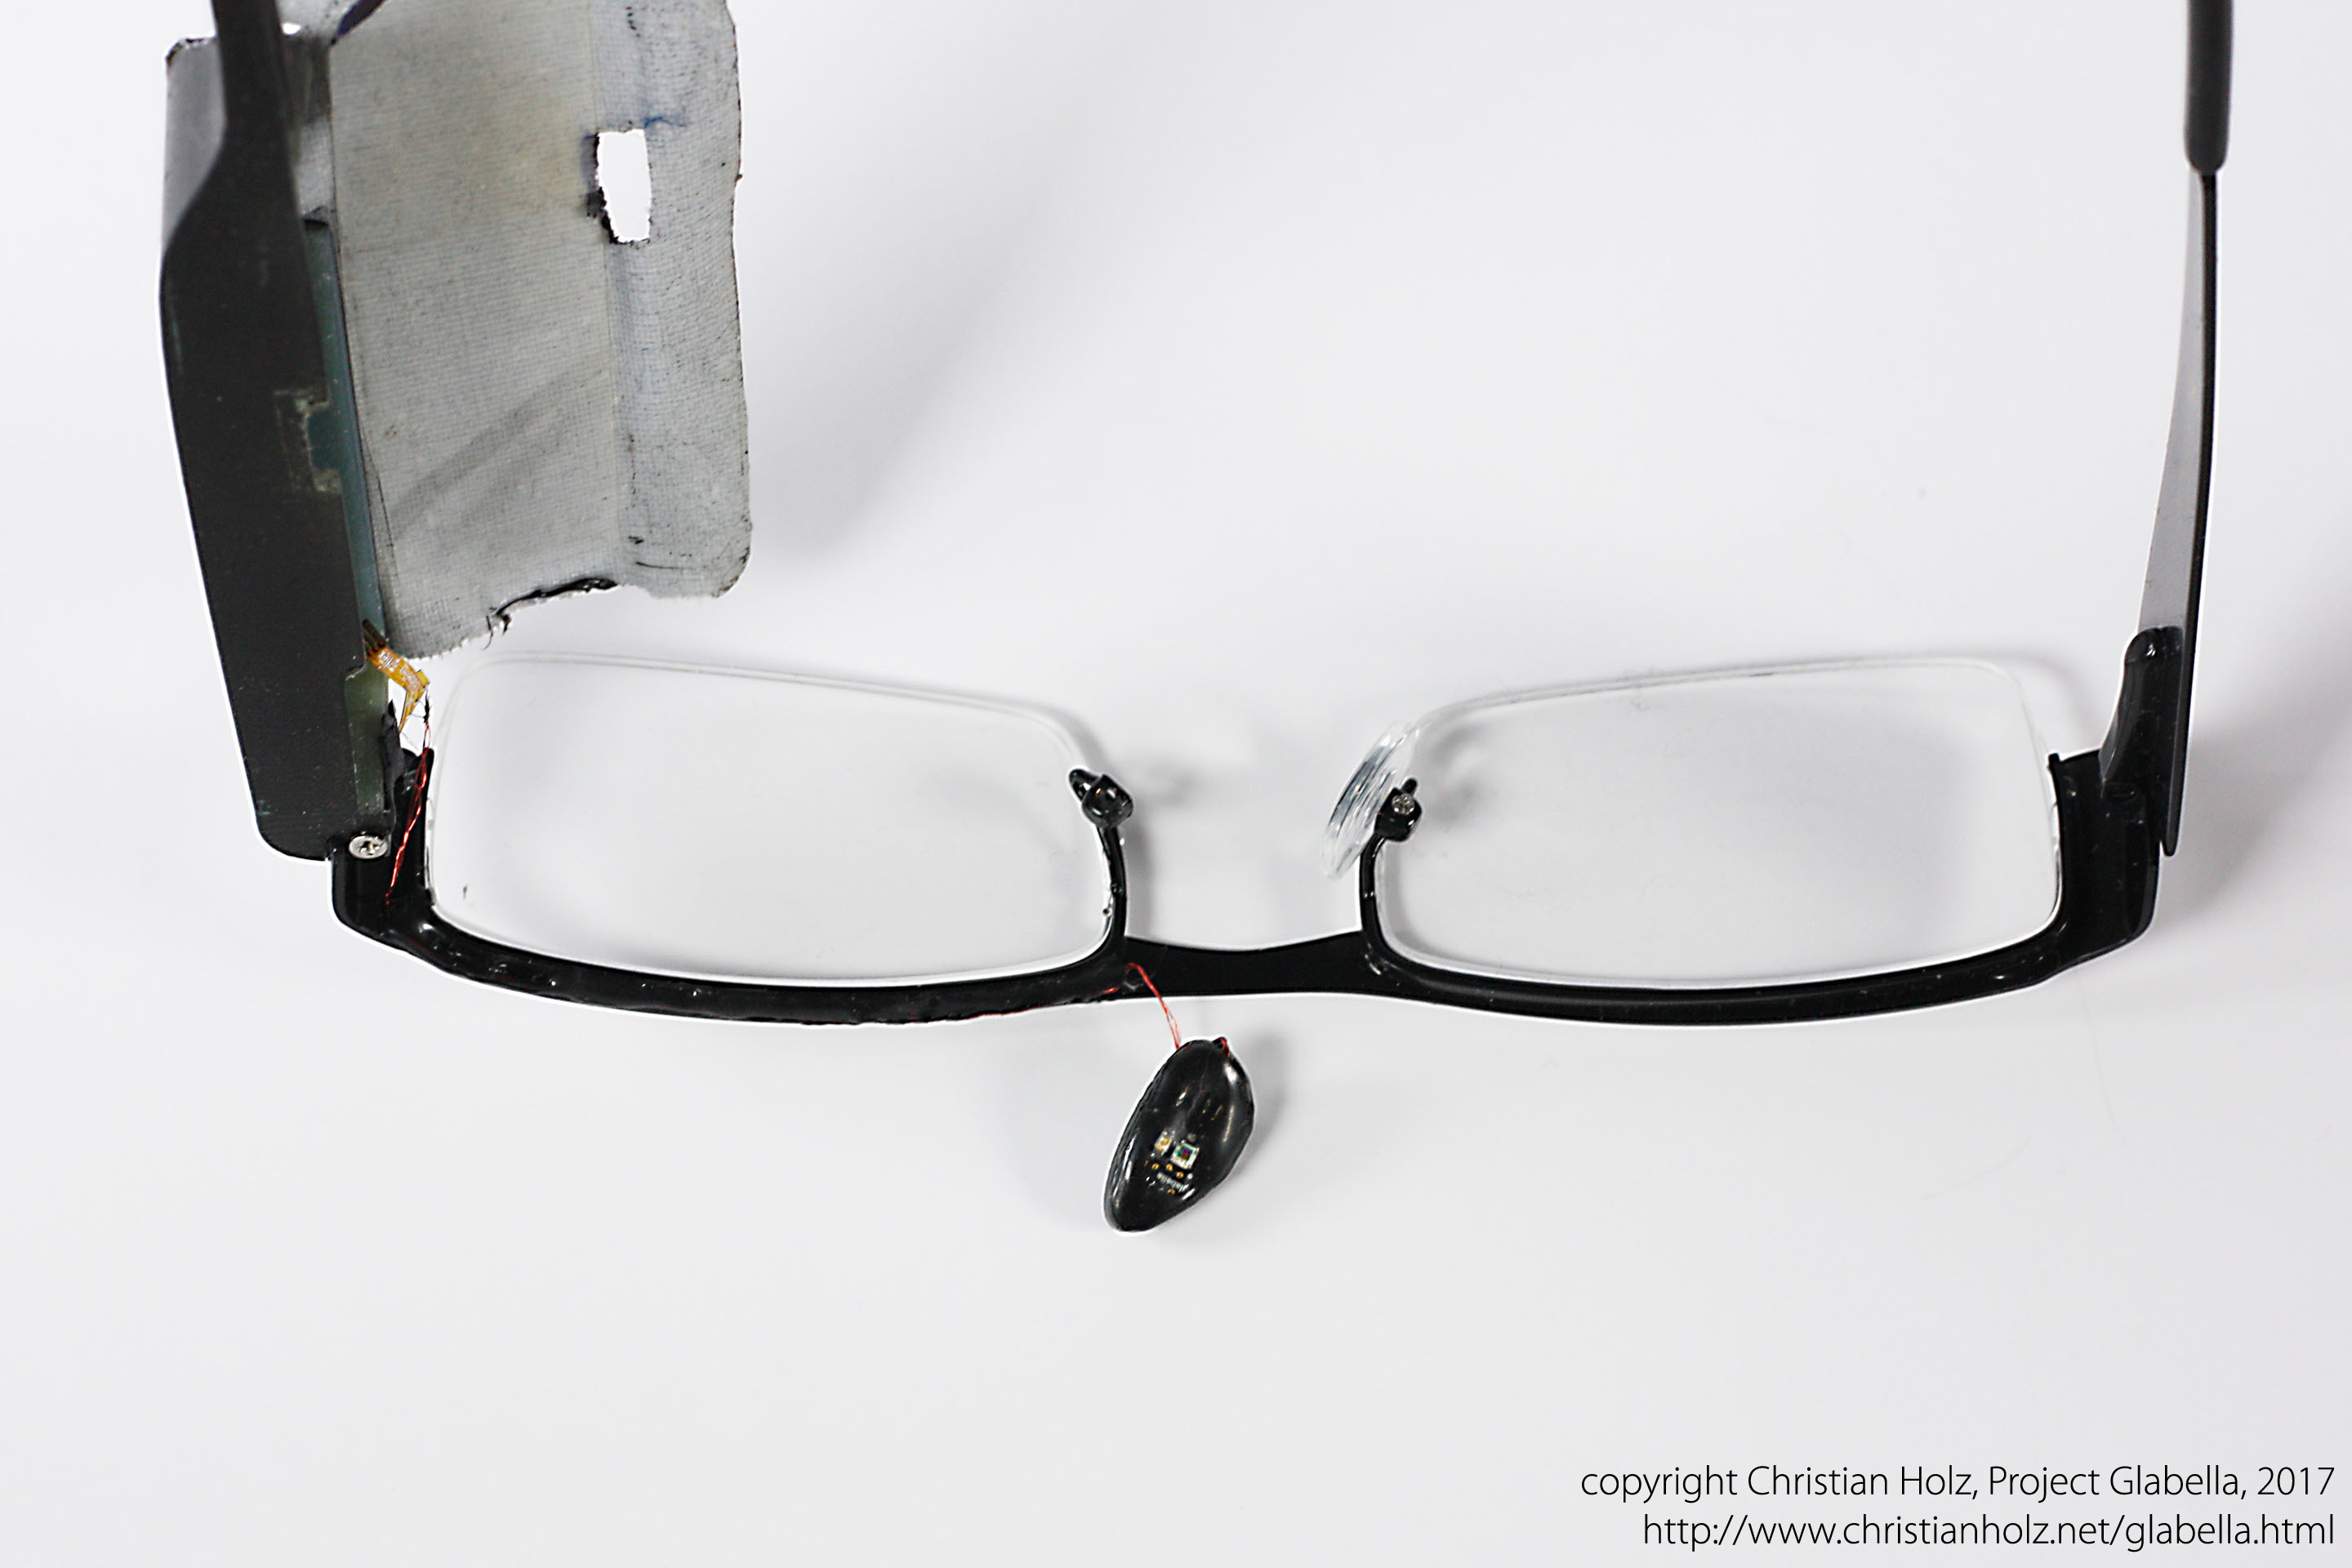
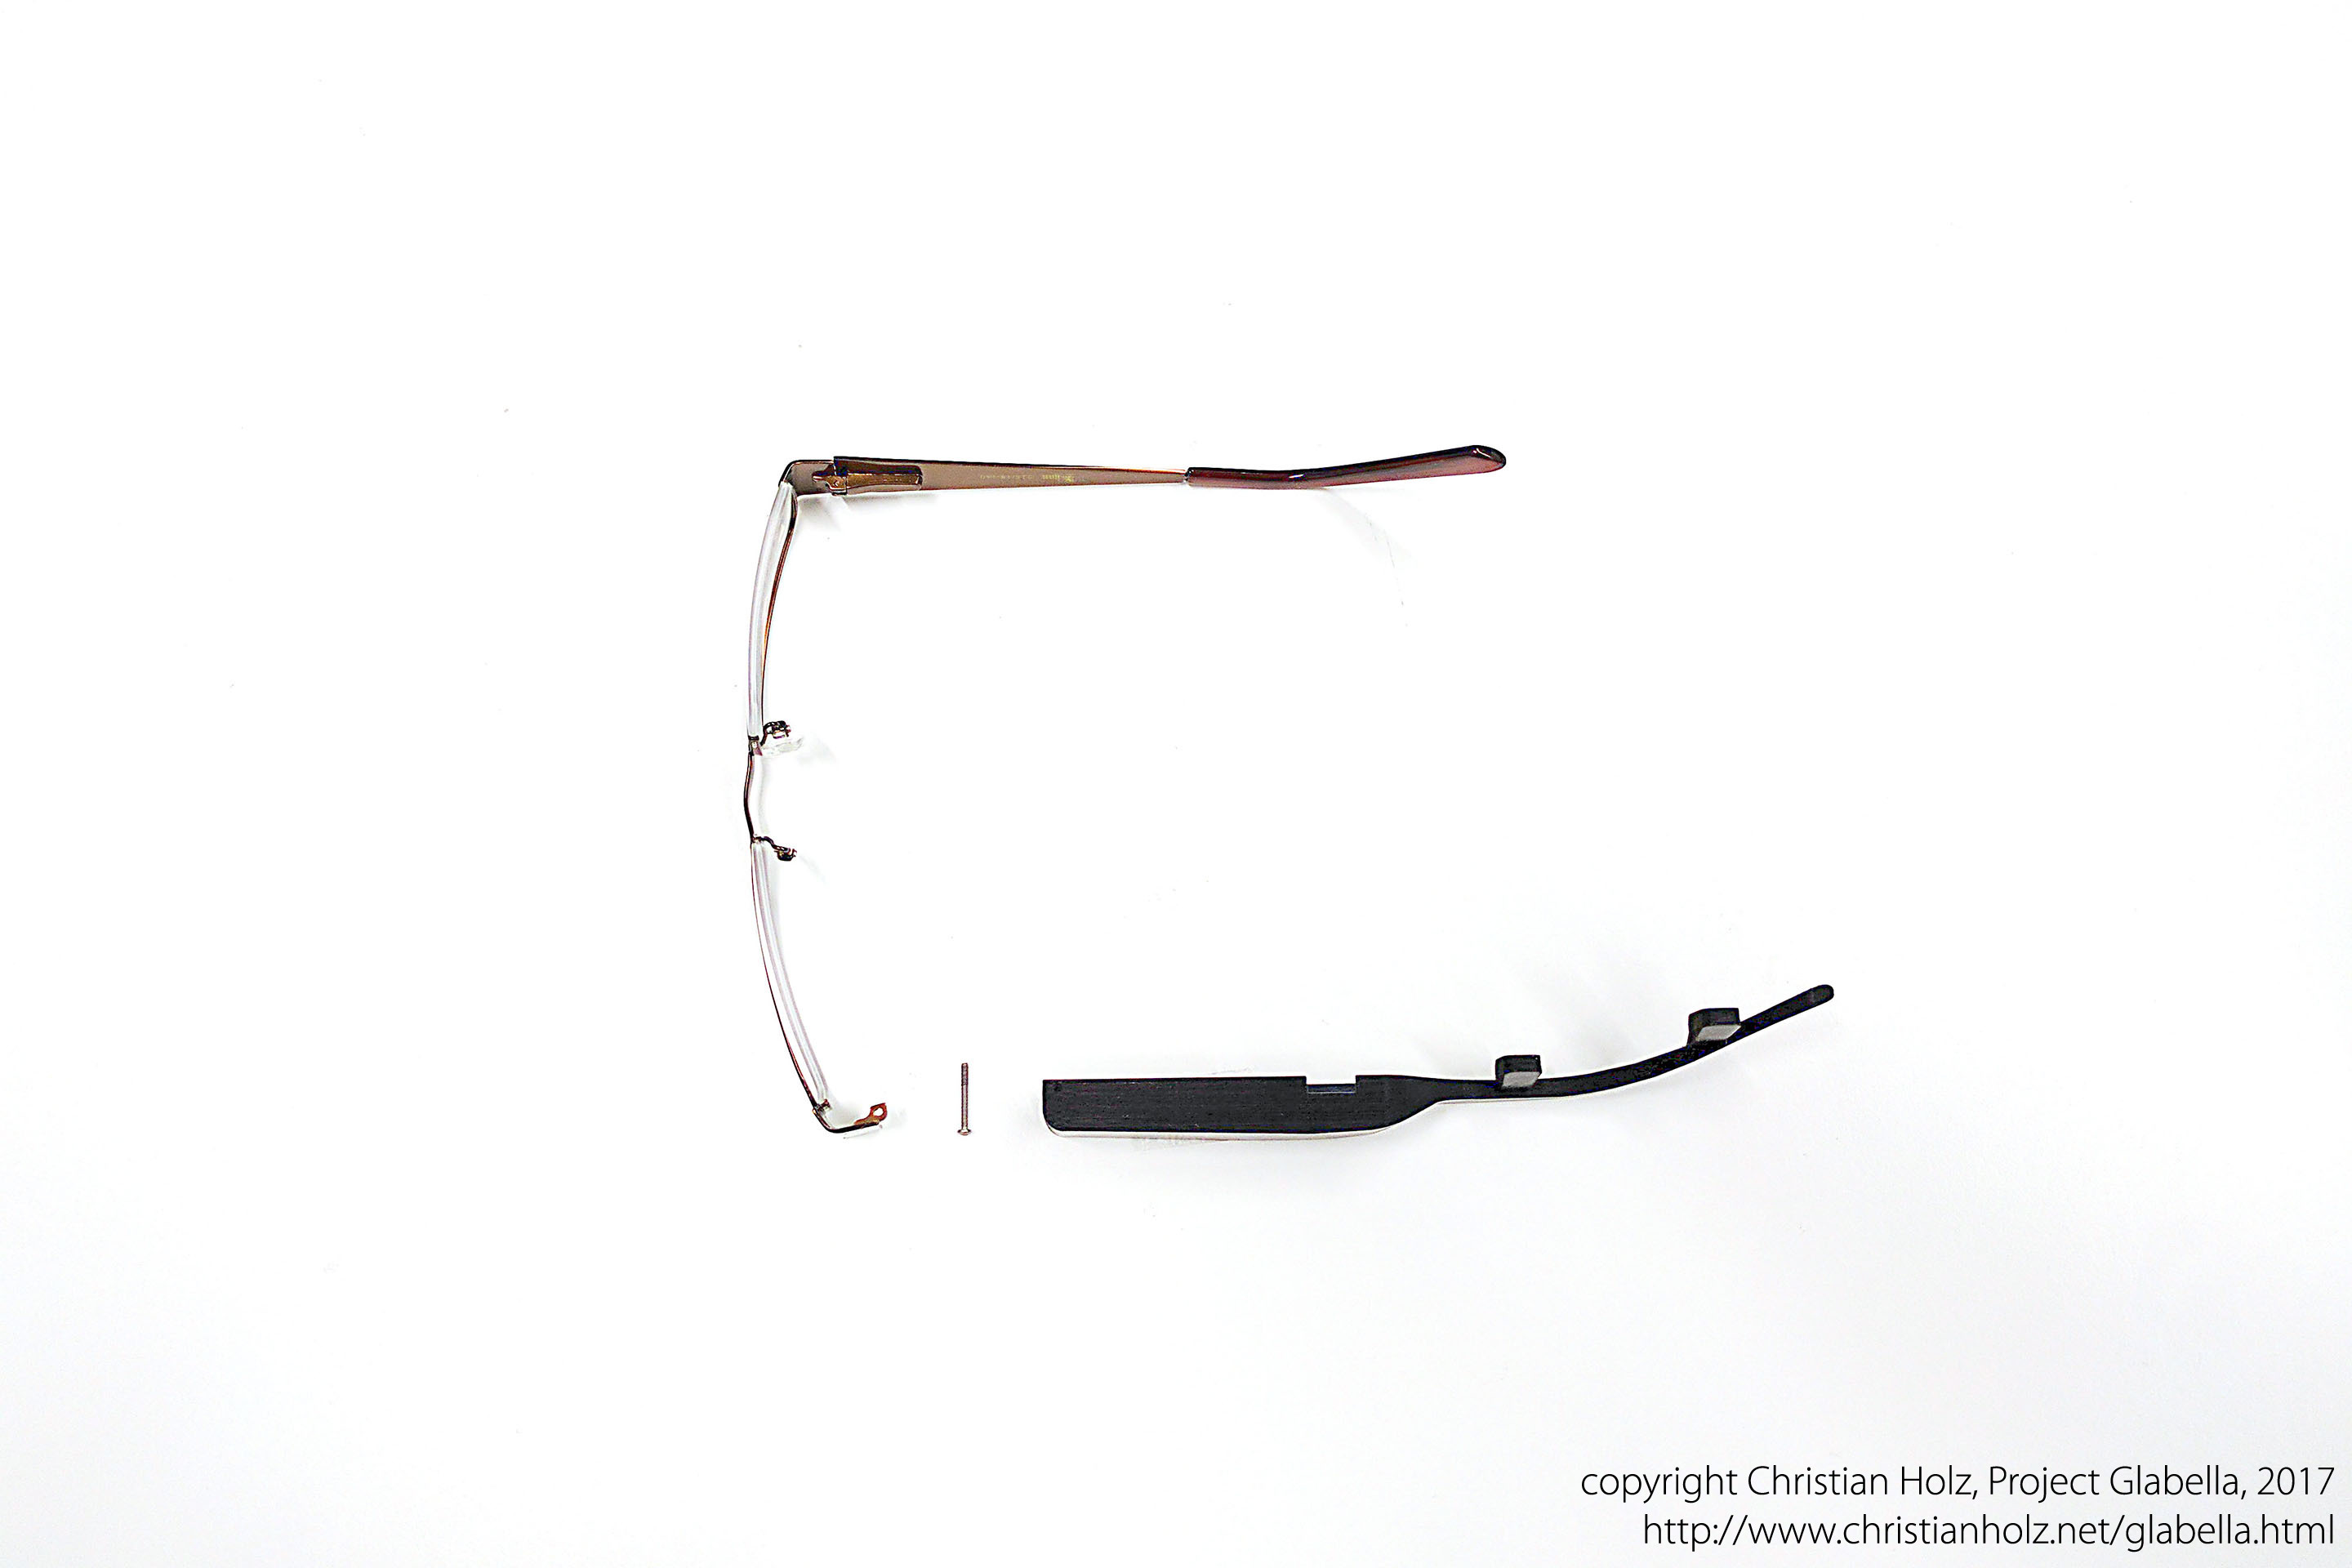
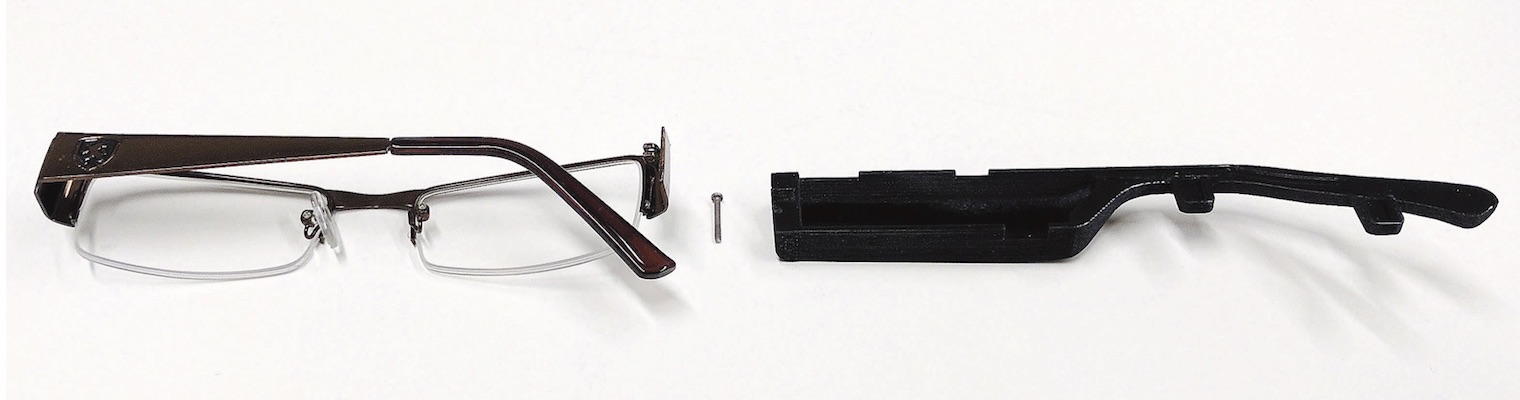
Breakout view of a Glabella prototype. Two sensor boards are integrated into the glasses frame, one is seamlessly integrated into a nose pad. The main board includes storage and processing components and hides in the side frame alongside the battery.
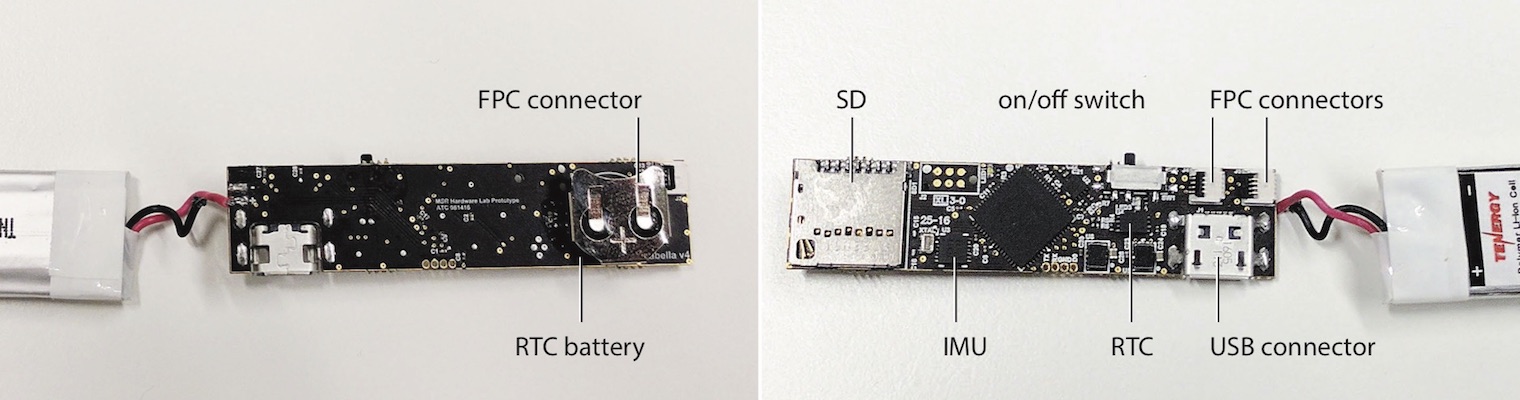
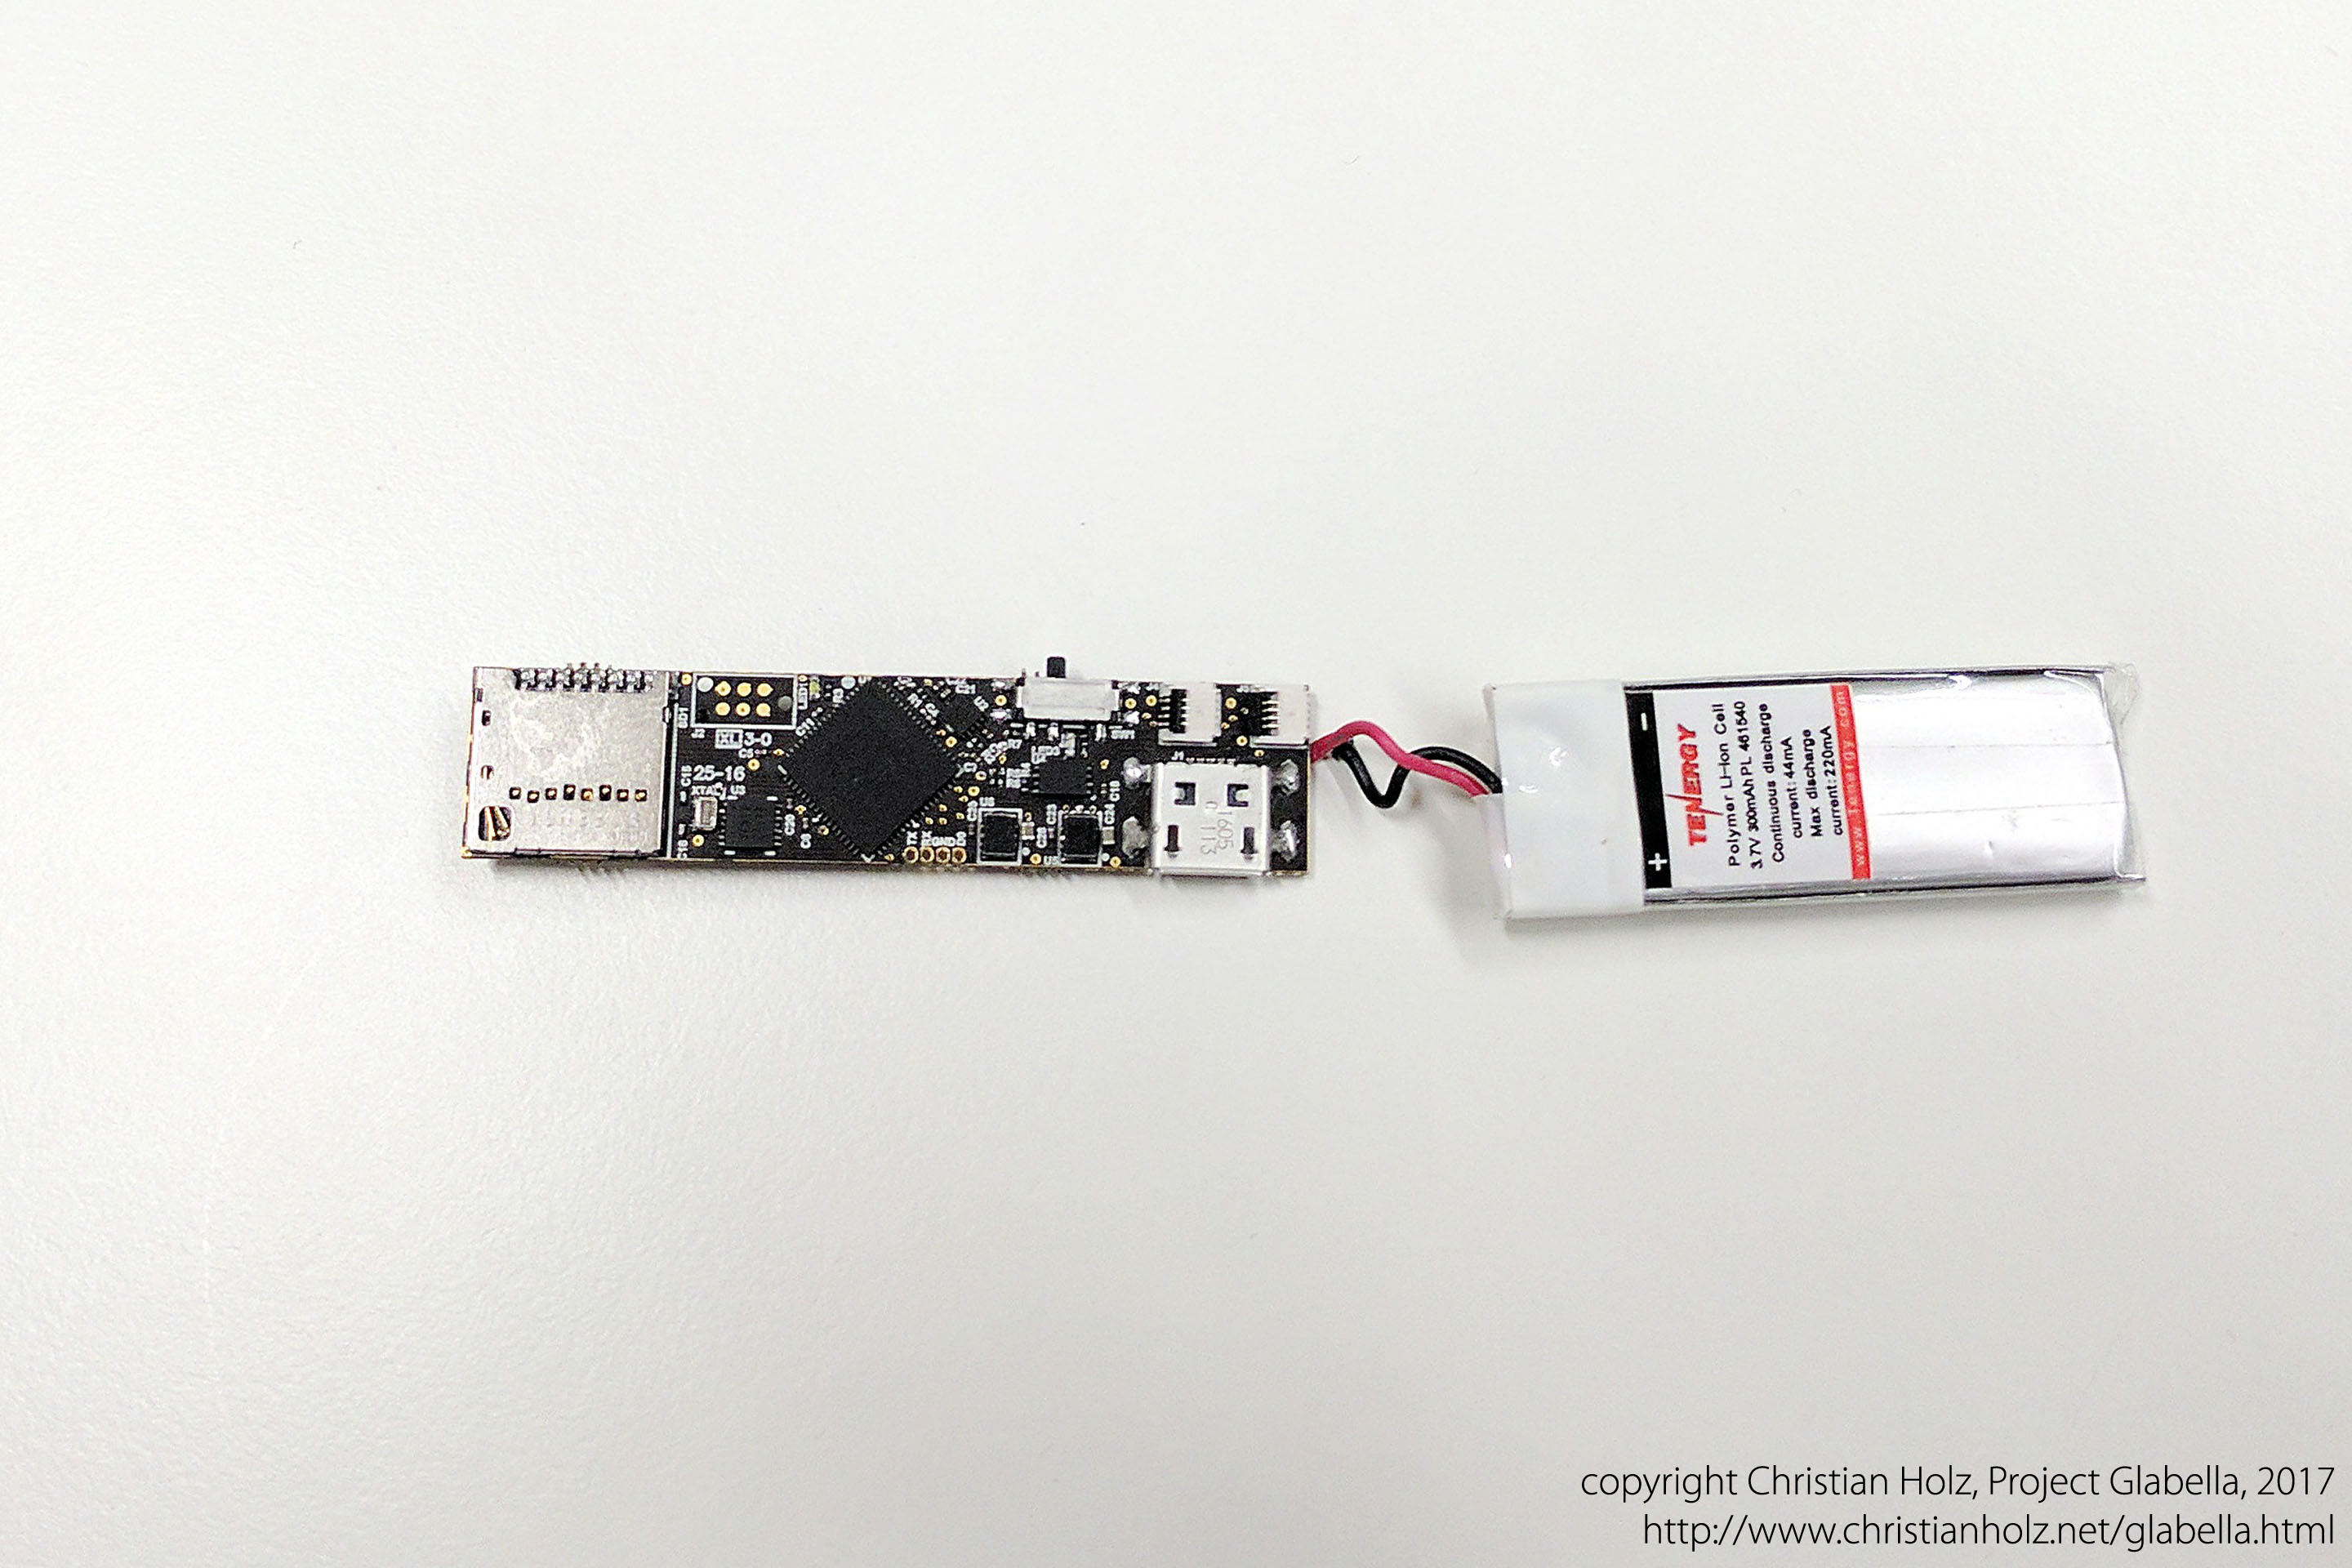
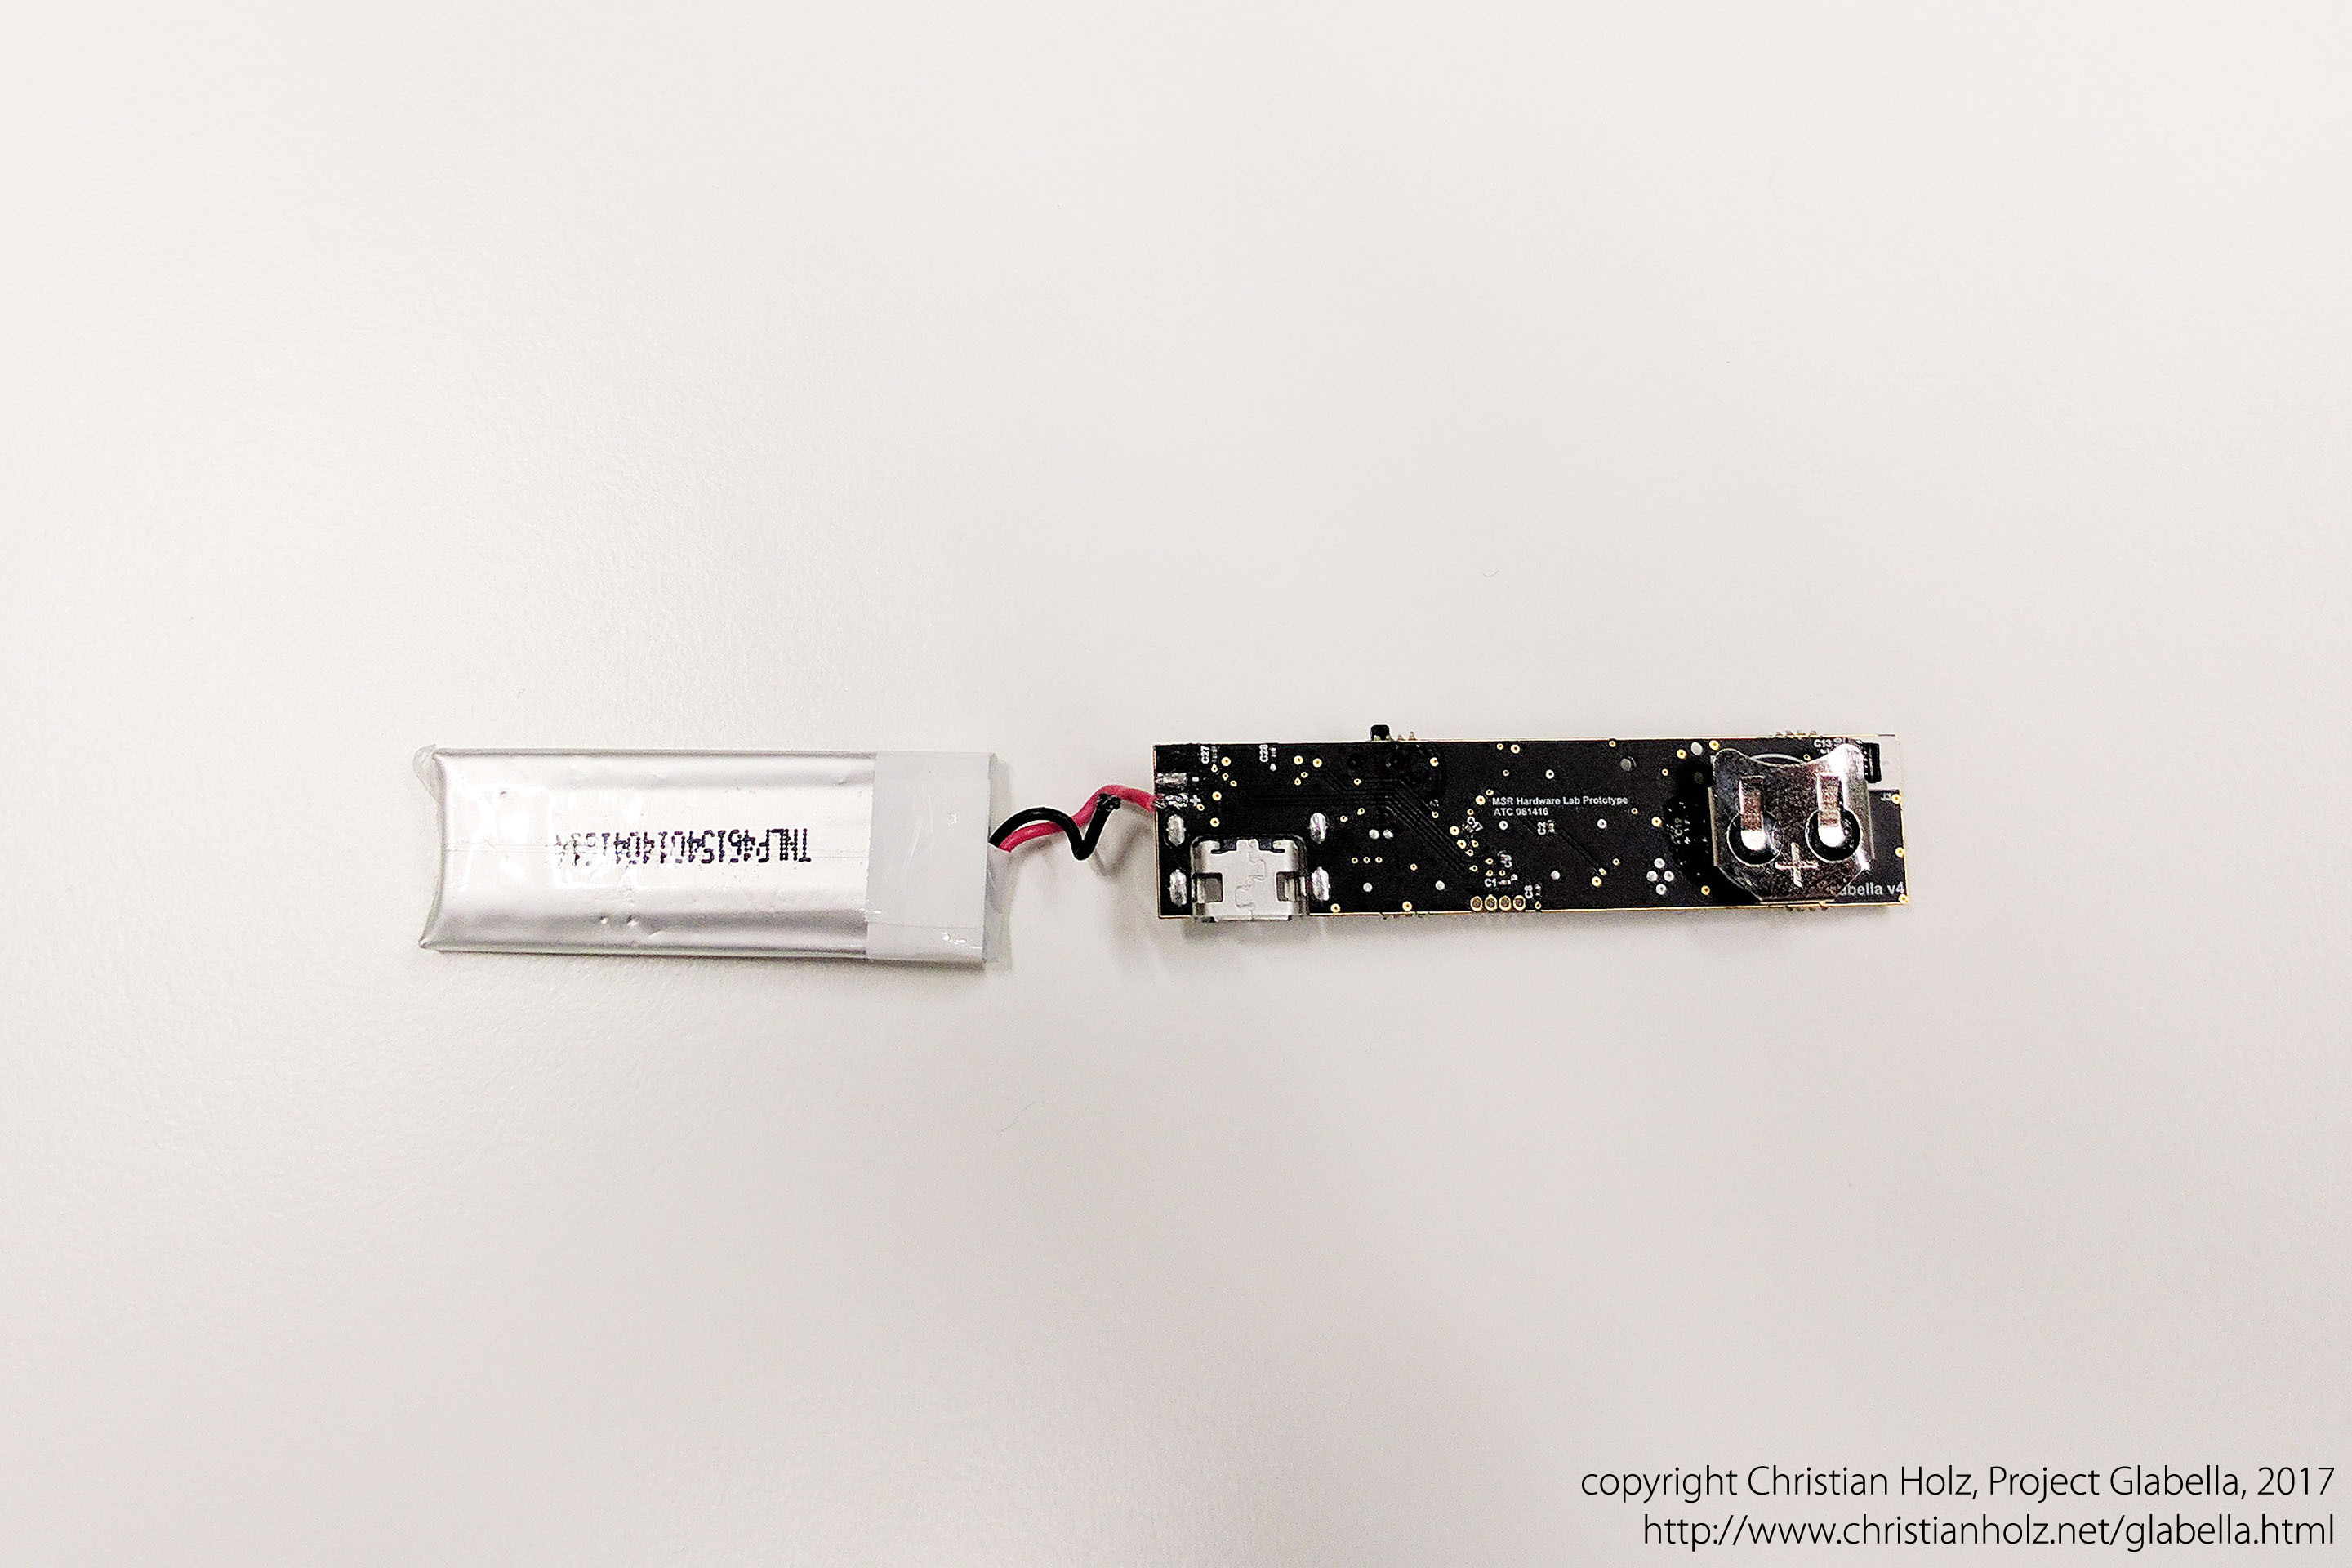
Glabella's main board and main components.
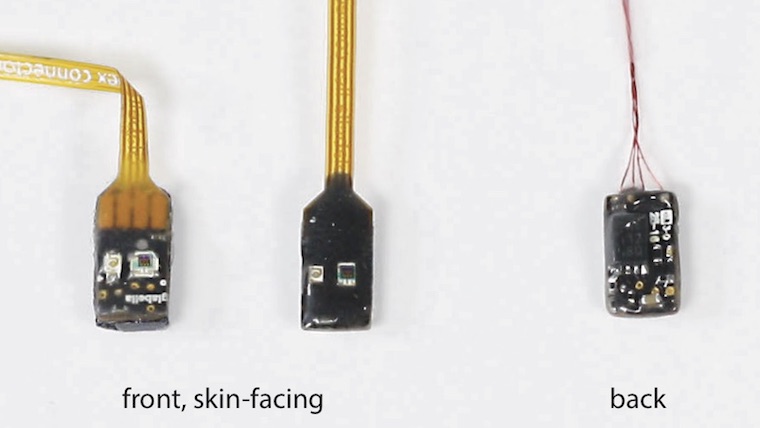
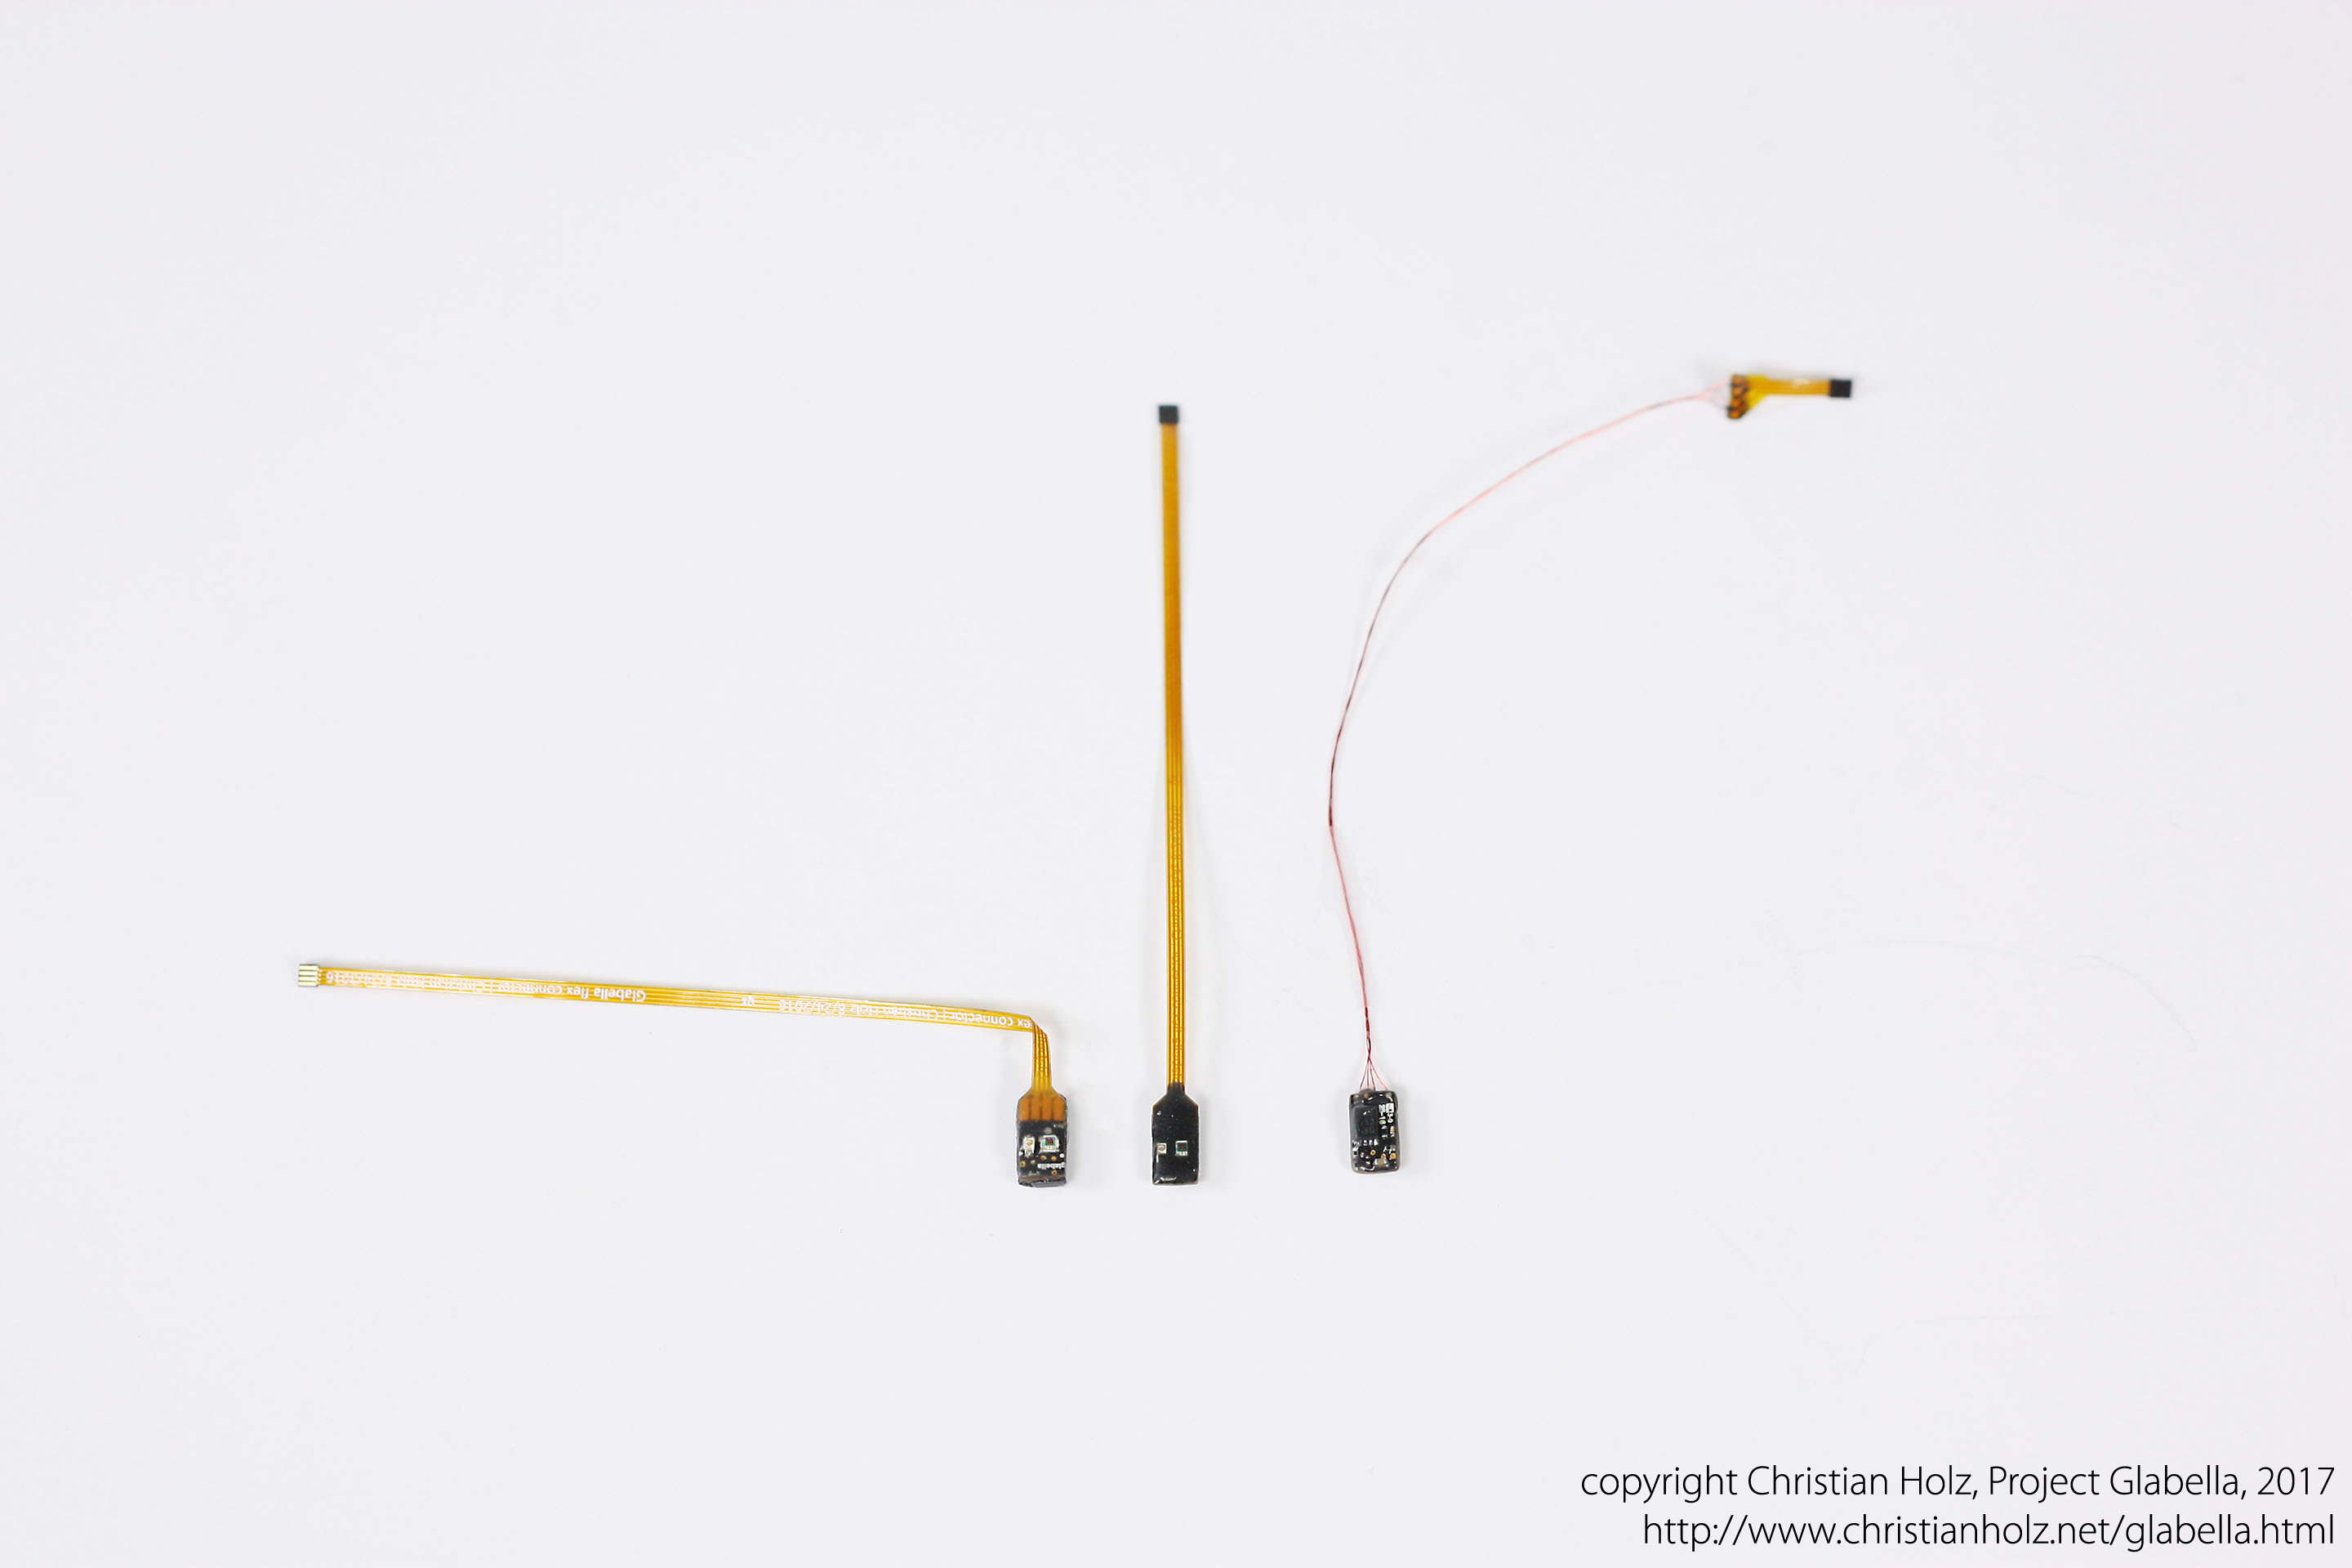
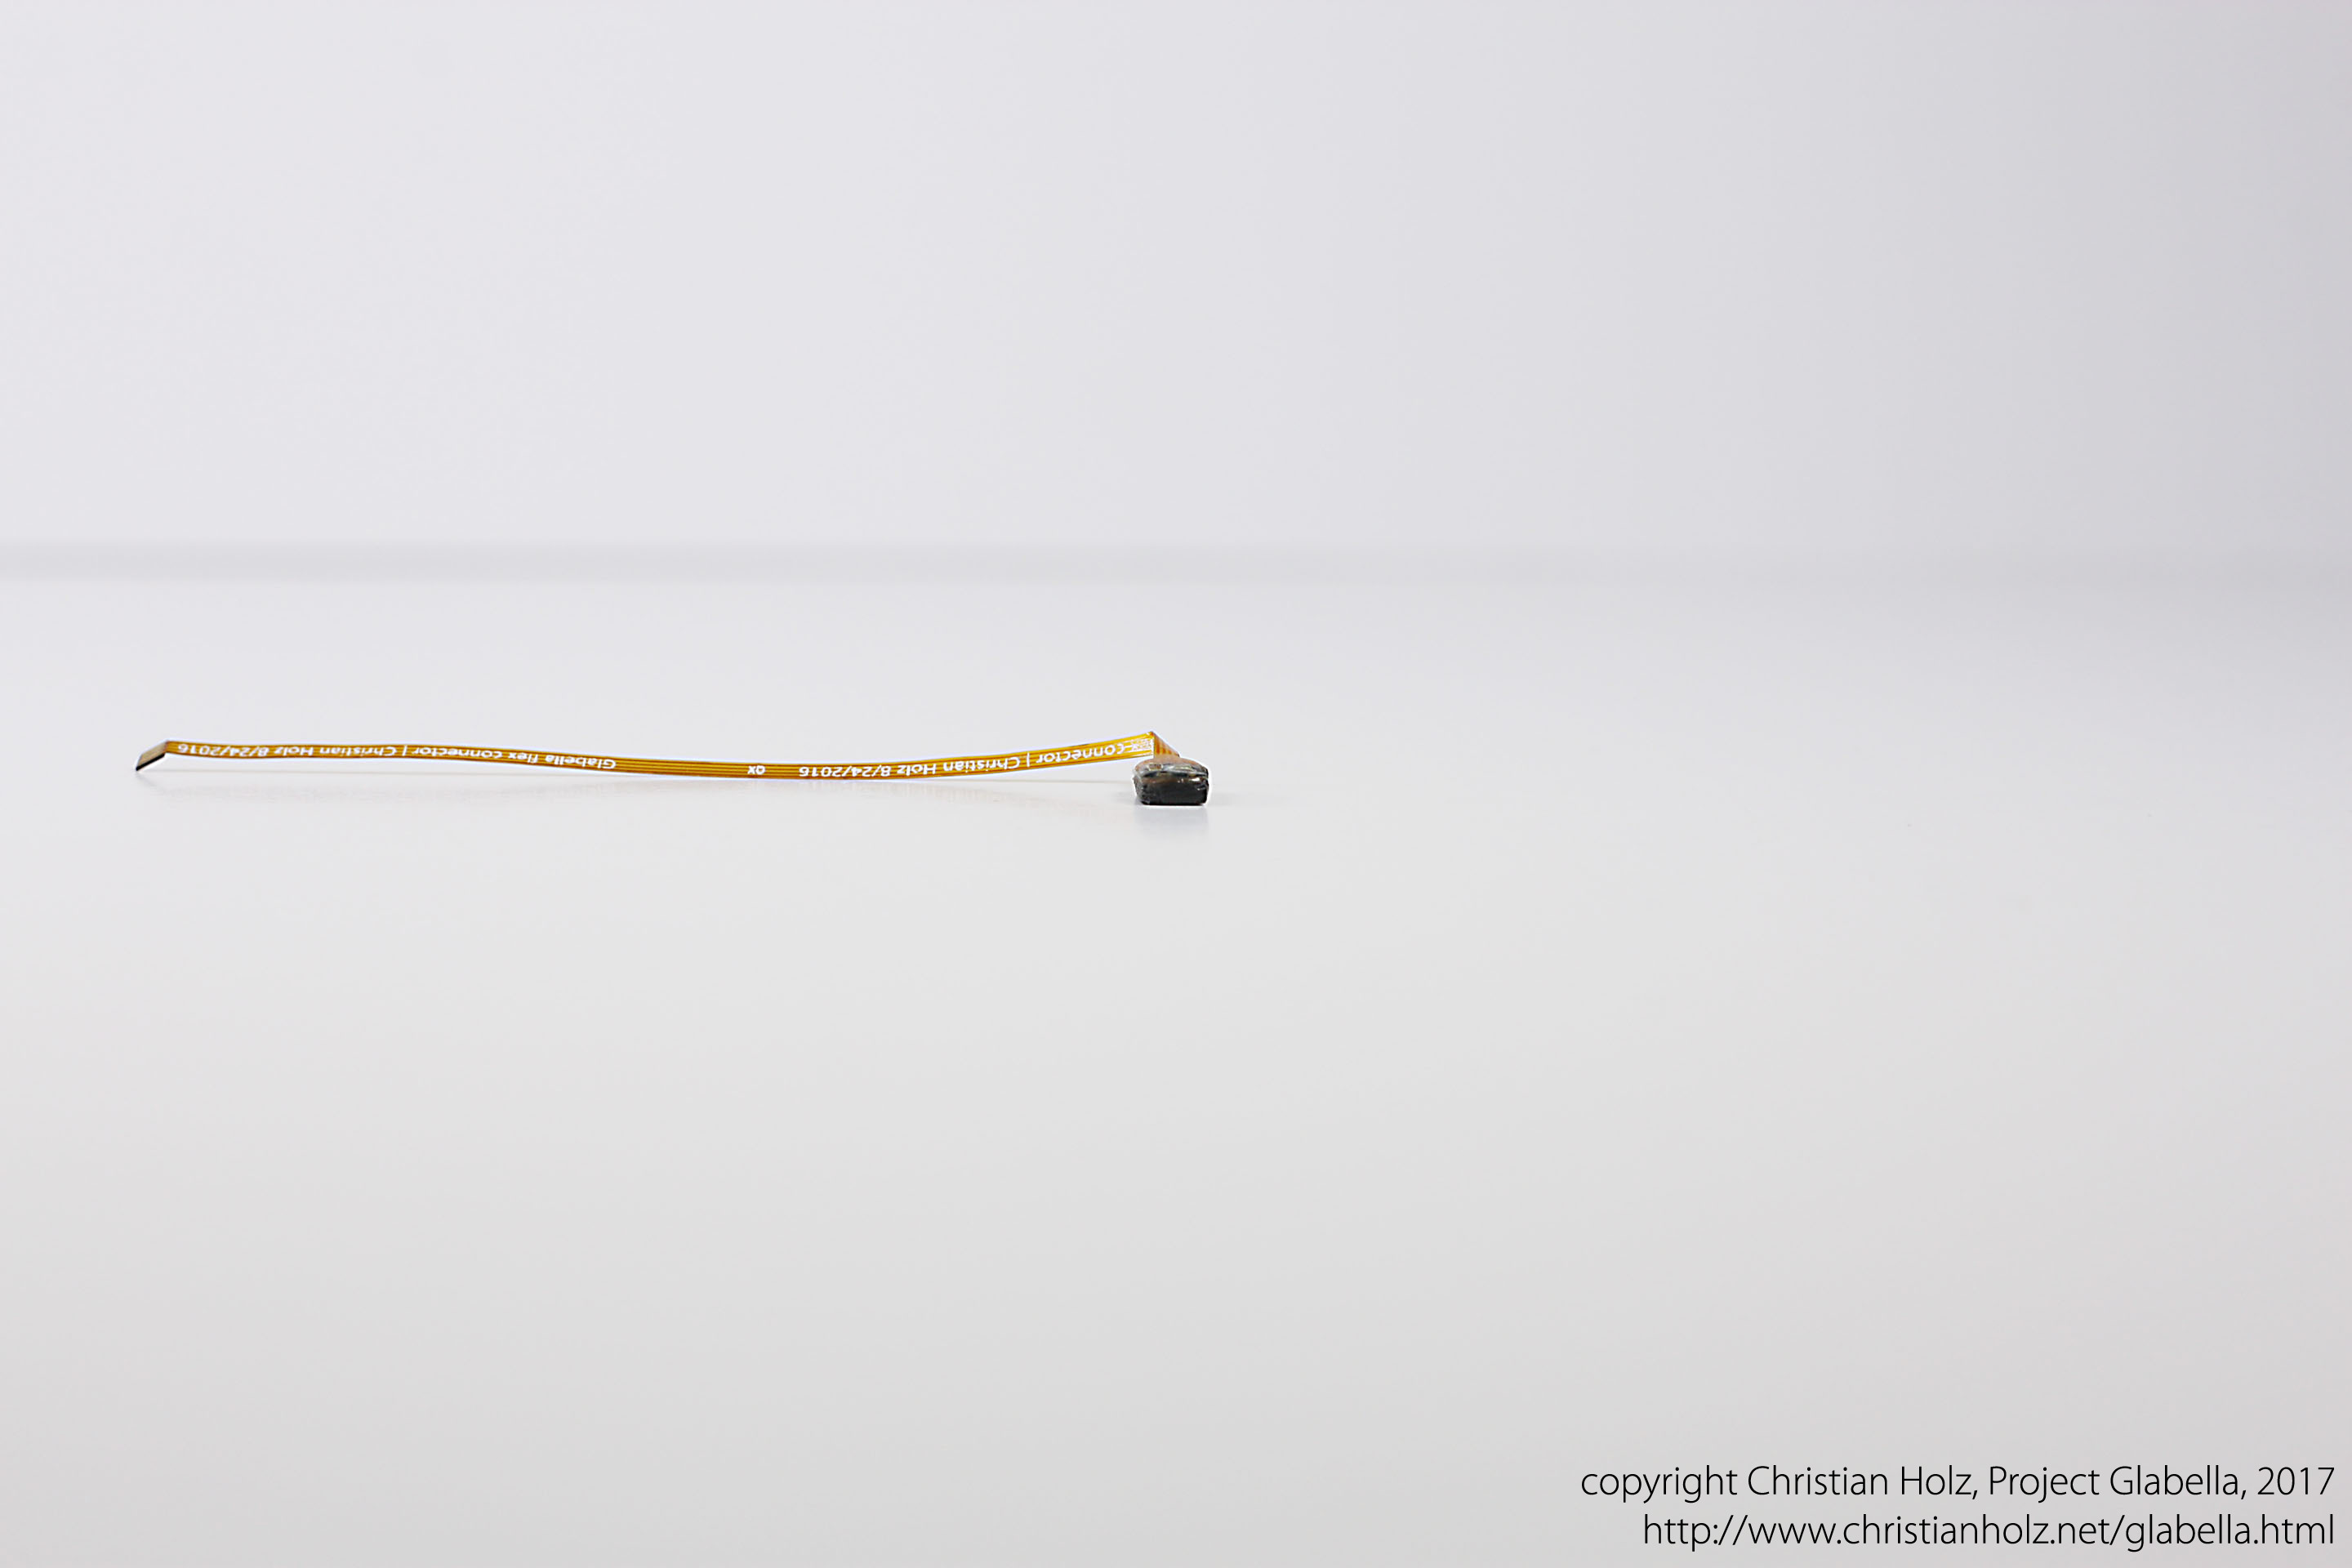
Glabella's sensor boards incorporate a photodiode, a corresponding and spectrum-matching green LED, and a small opamp circuit. The PSoC-integrated ADC on the main board digitizes all signals in synchrony. (Left) Custom FPC cables connect the two sensor boards in the frame to the main board. (Right) Thin magnet wires connect the sensor board that is embedded in the nose pad to the main board, routed along the frame for minimal visibility.
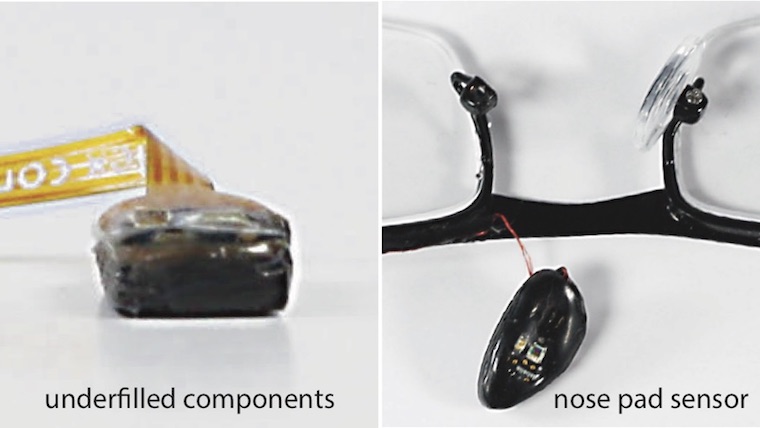
To limit the exposure of our sensor boards to the user's skin and protect them from external influences, such as sweat, we underfilled all components using fine traces of hot glue that we manually reflowed. Using an underfill keeps the main components of the sensor board exposed to make direct contact with the wearer's skin, such that the LED and the photodiode optimally inject light into the skin and observe optimal reflections, respectively.
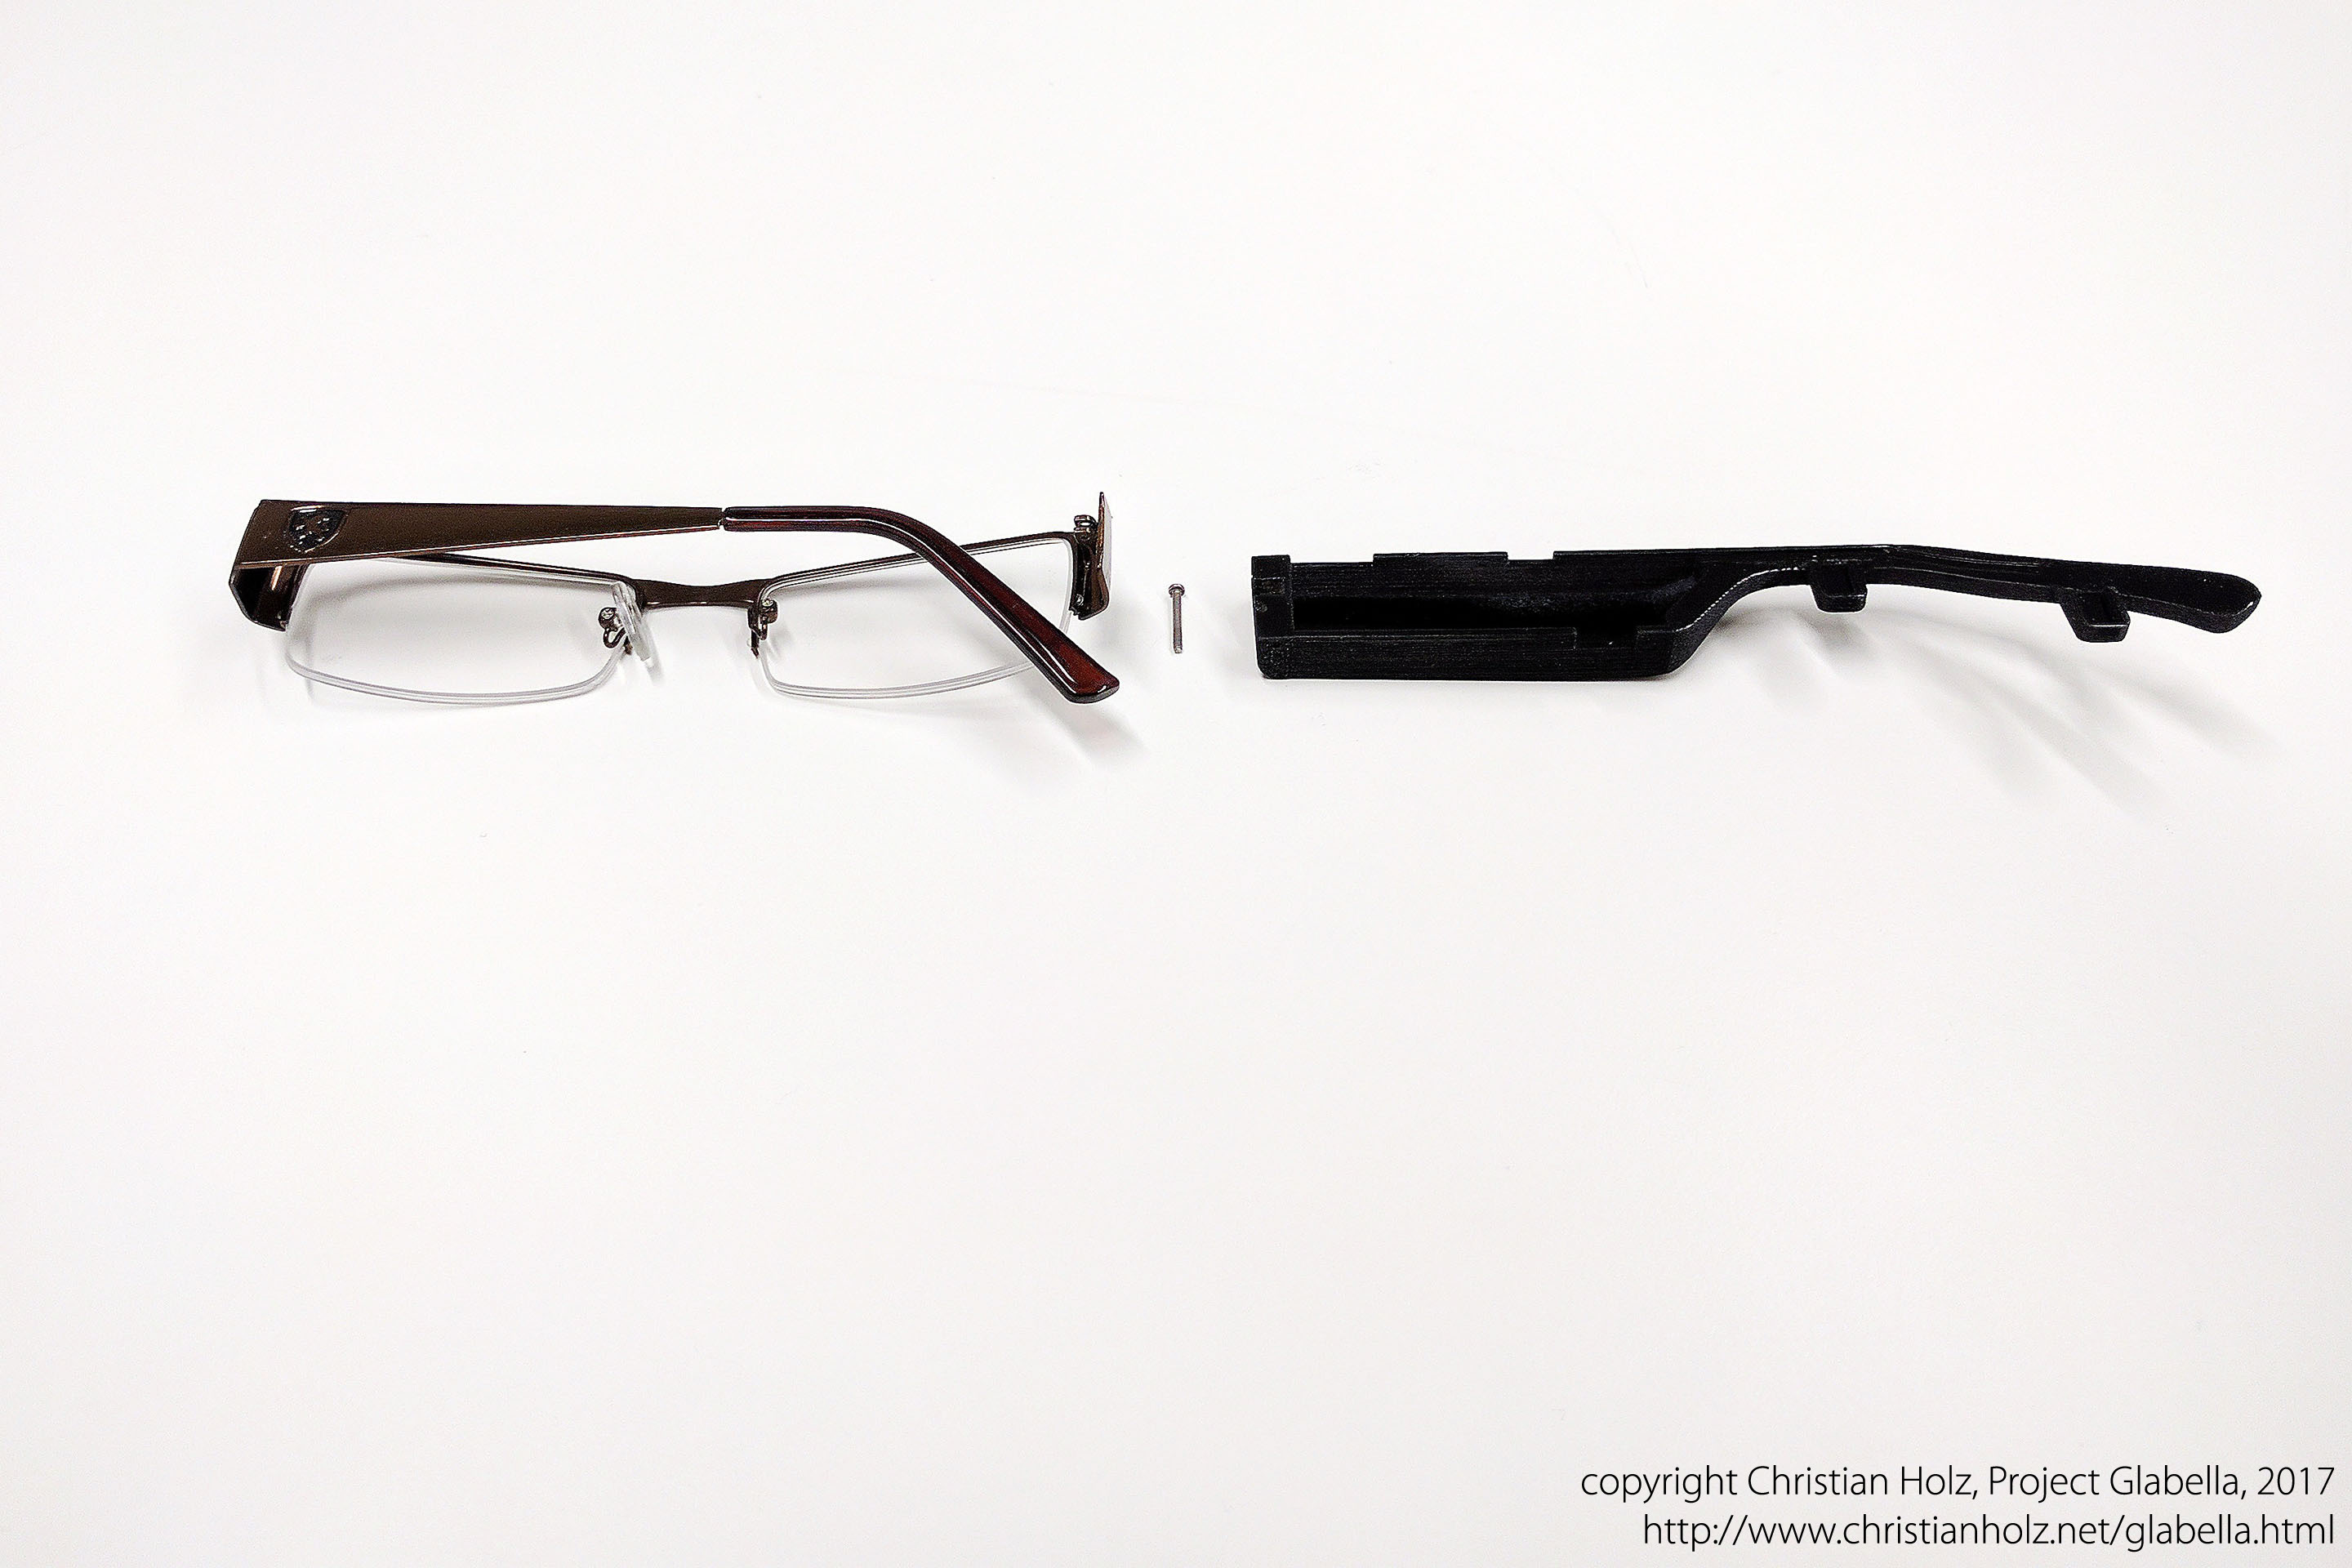
Mechanical design of the frame. The ABS-printed frame is parametric for easy adjustment to each wearer's head dimensions. Cavities accommodate the main board and the sensor boards. The groove along the frame routes FPC cables between all boards. We close the frame using black tape.
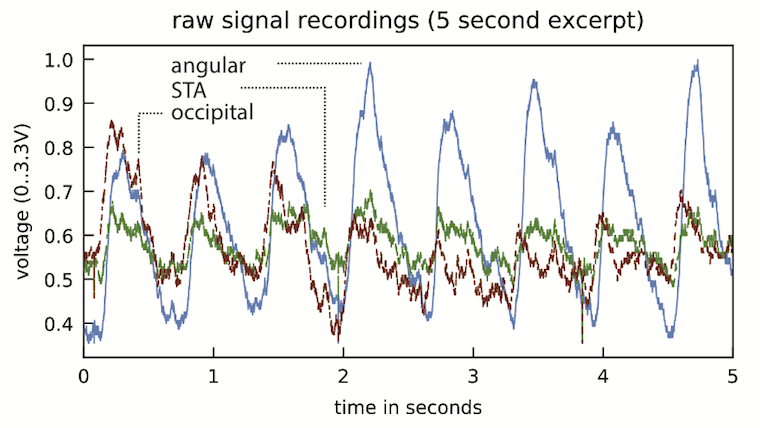
Raw signal captured by the sensors, here a particularly bad example due to the opamp recovery from railing intensities just before restoring the proper amount of signal amplification.
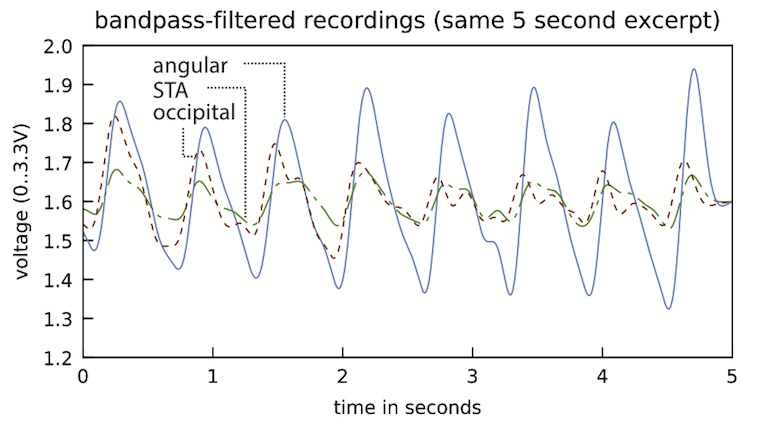
After applying a 0.4 Hz–8 Hz bandpass filter to the raw intensities, the pulse reflections exhibit clearly their characteristic features, which we consequently detect for extracting timestamps.
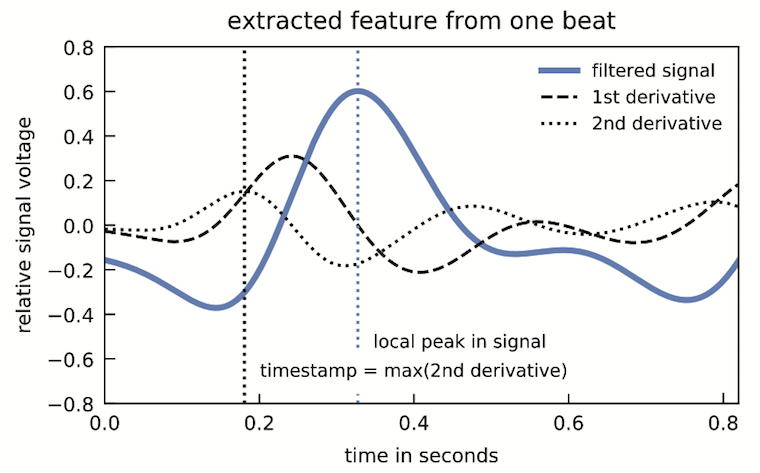
Illustration of a single beat after applying a bandpass filter. We compute the feature timestamp from the local maximum of the 2nd derivative of each of the signals (dotted vertical line) just before the local peak of the signal (blue dotted vertical line).
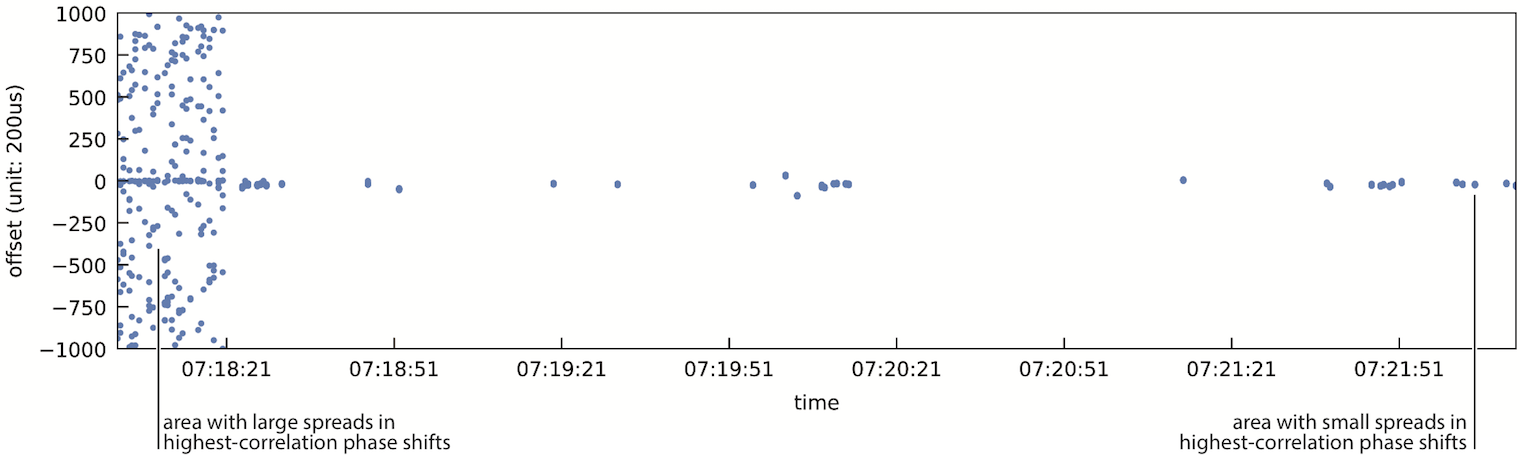
Plotting the spread of the top 50 phase shifts for two correlated signals for each heart beat reveals periods of low spreads, which we consequently use as beat candidates for PTT computation, as well as large spreads, which we discard. Note that during times when only few phase shifts appear to be visible in the chart (e.g., right part of the plot), they belong to adjacent offsets, thus resulting in a minute vertical spread. Periods without any values represent times when the sensors were off or those during which the device was moving as detected by the accelerometer.
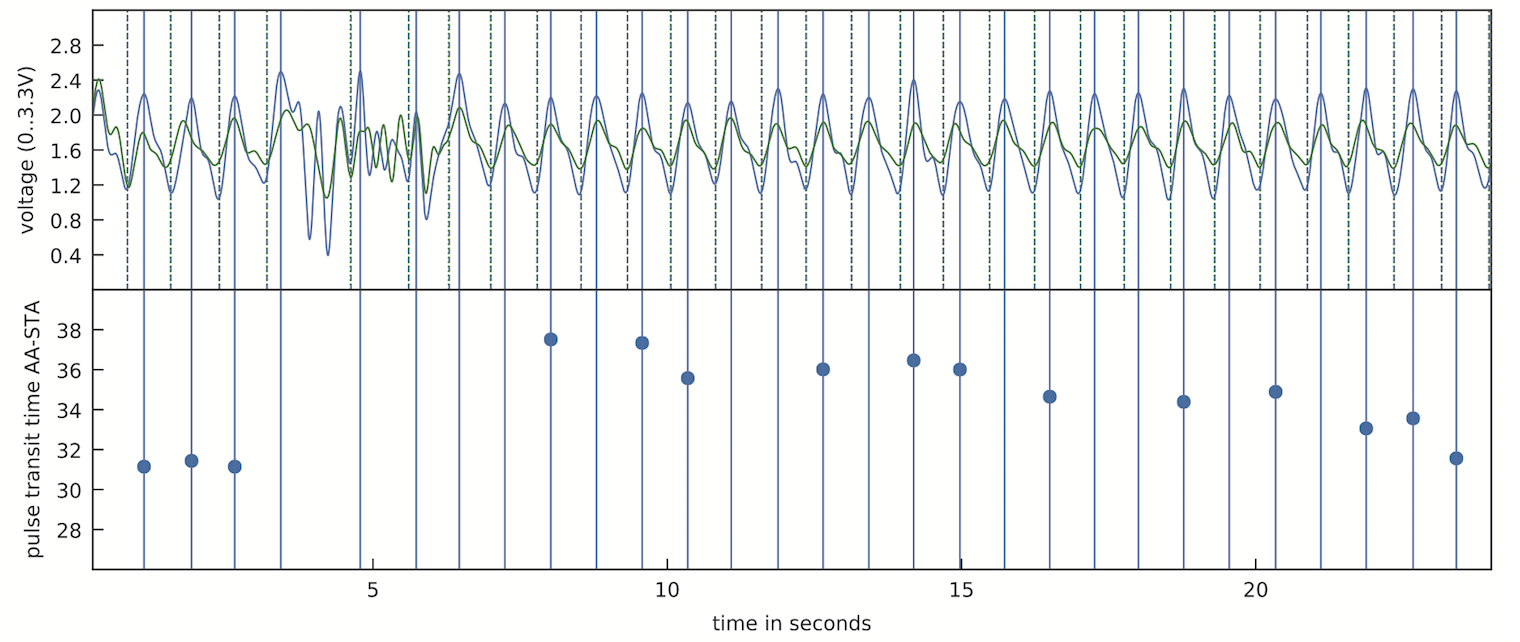
Two pulse signals over the course of 16 seconds, from which we extract pulse transit times on a beat-by-beat basis. If the feature points around a pulse in the continuous stream of reflections fails our quality control, we skip the computation of the pulse transit time for this beat. In this example, the PTT curve shows the behavior of a person standing up wearing the prototype a er leaning back for 5 minutes. This produces a quick drop in relative systolic blood pressure, which quickly recovers to the previous values.
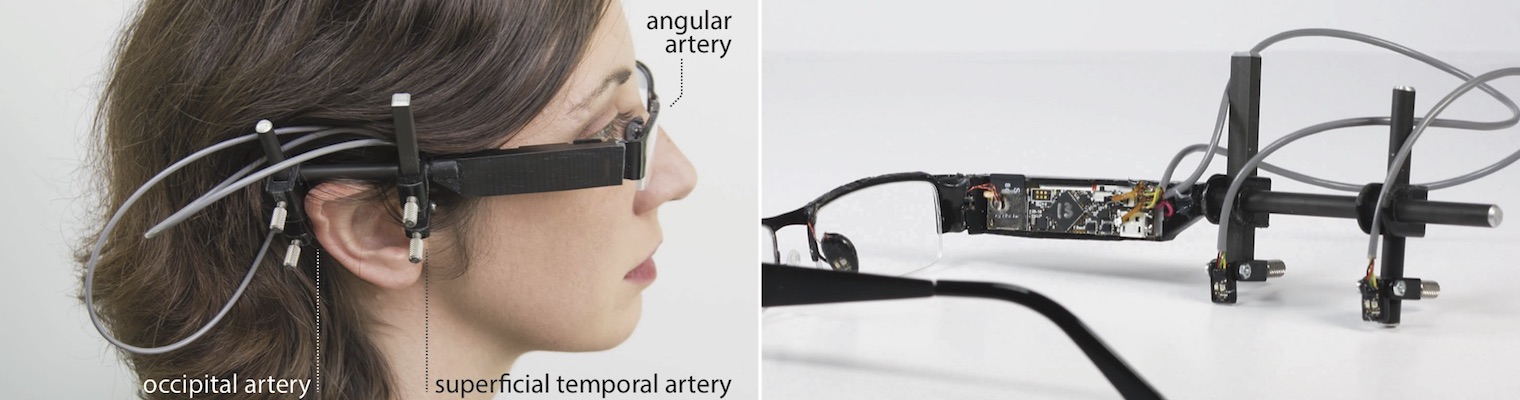
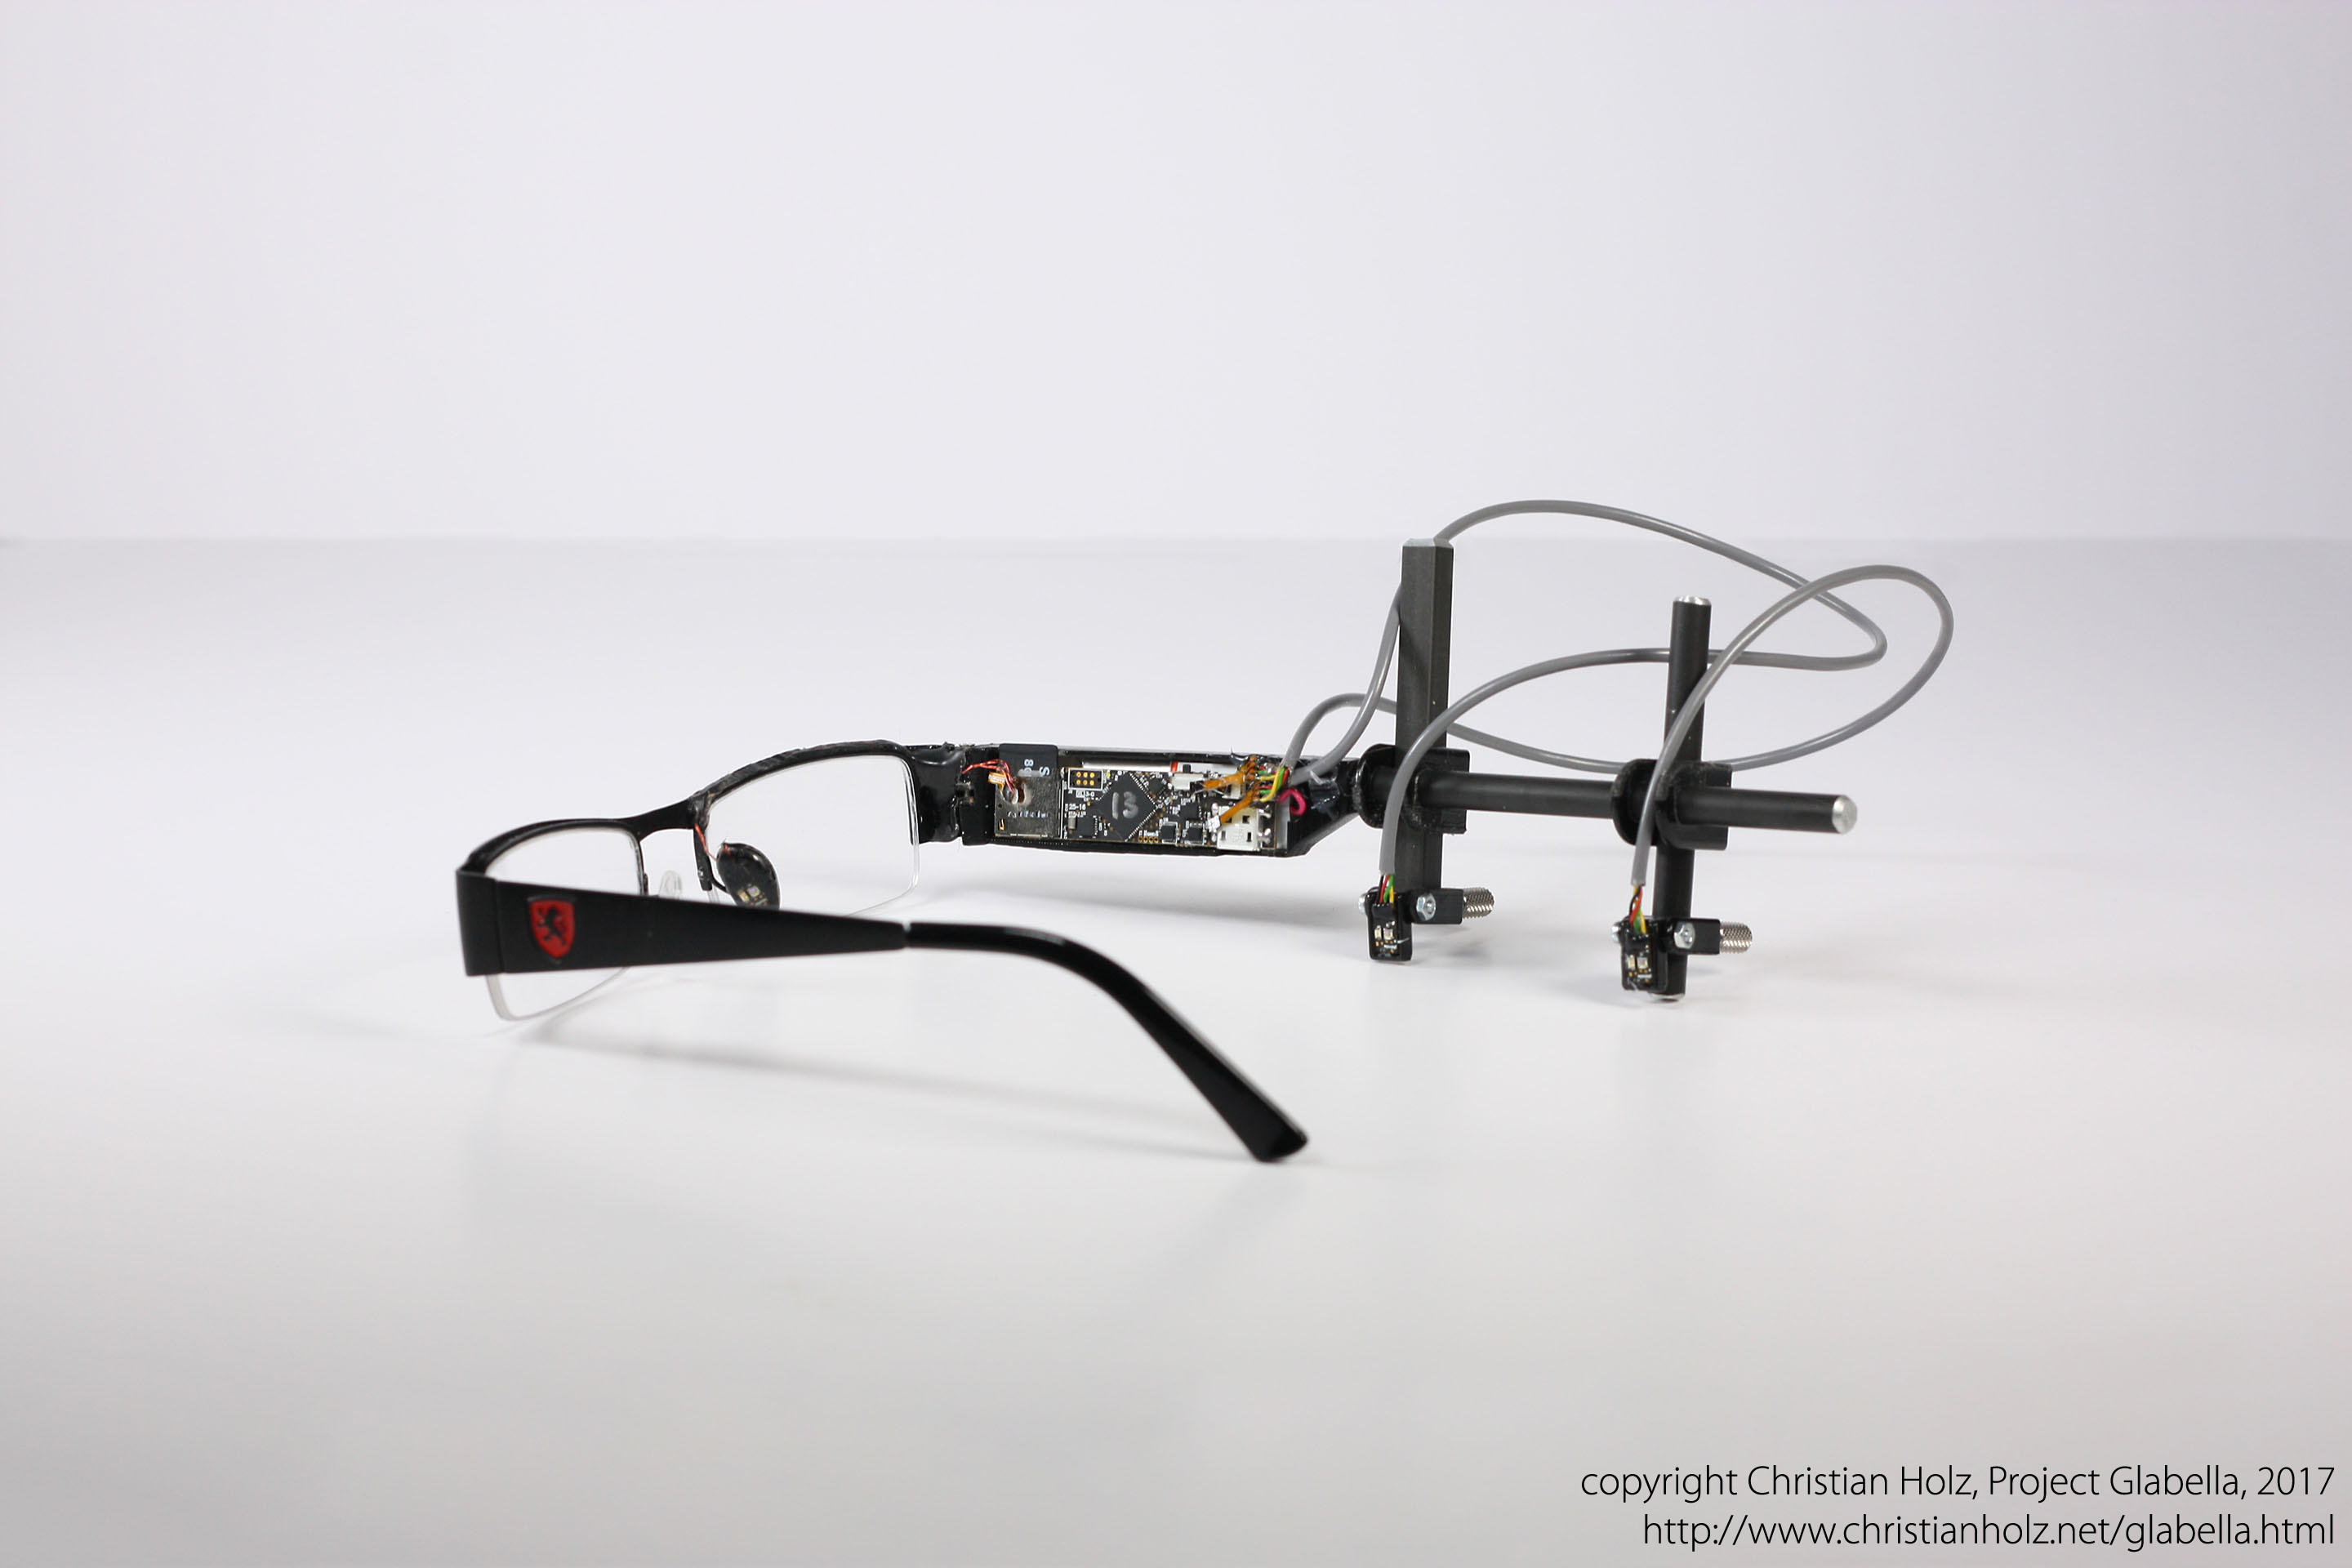
Our adjustable lab prototype that recorded the pulse waves shown in the figure above. While Glabella rigidly integrates the two sensor boards inside the frame at user-specific locations, this prototype features adjustable joints for translation, tilt, and rotation to fit a user's head dimensions.
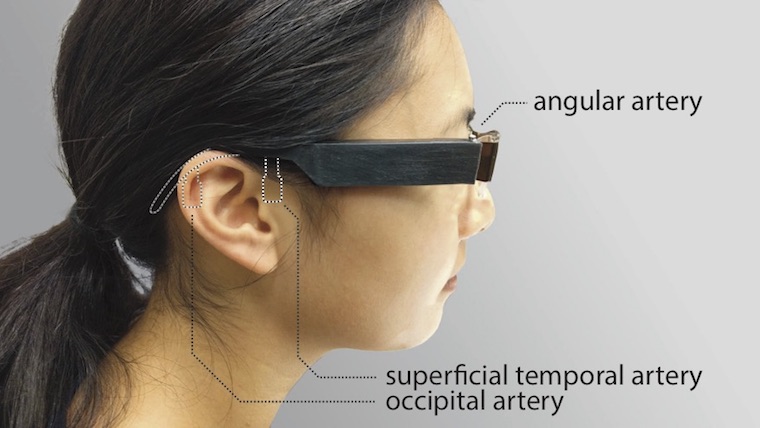
During the screening session, we measured each participant's head dimensions to precisely fit the sensor on the location of their superficial temporal artery and occipital artery in the 3D printed case, respectively. The sensor on the participant's angular artery was fixed and embedded into the nose pad of the frame.
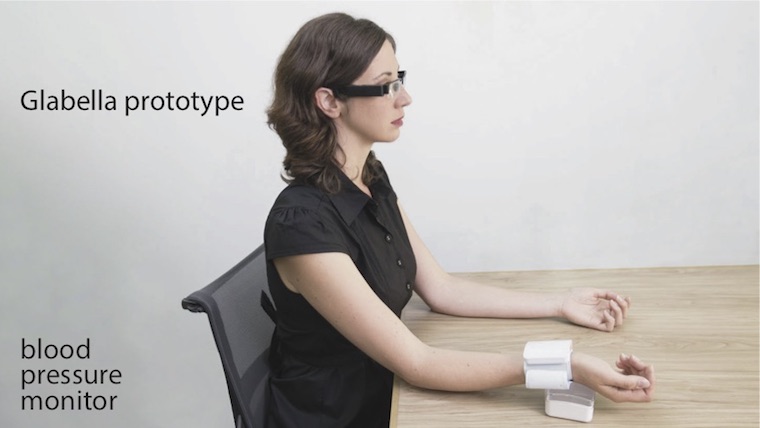
Each participant recorded values using two interfaces during the study. Our Glabella prototype glasses continuously recorded the user's pulse reflections at three sites on their head. Three times an hour, participants took a blood pressure measurement using a commercial cuff-based wrist-mounted radial blood pressure monitor.
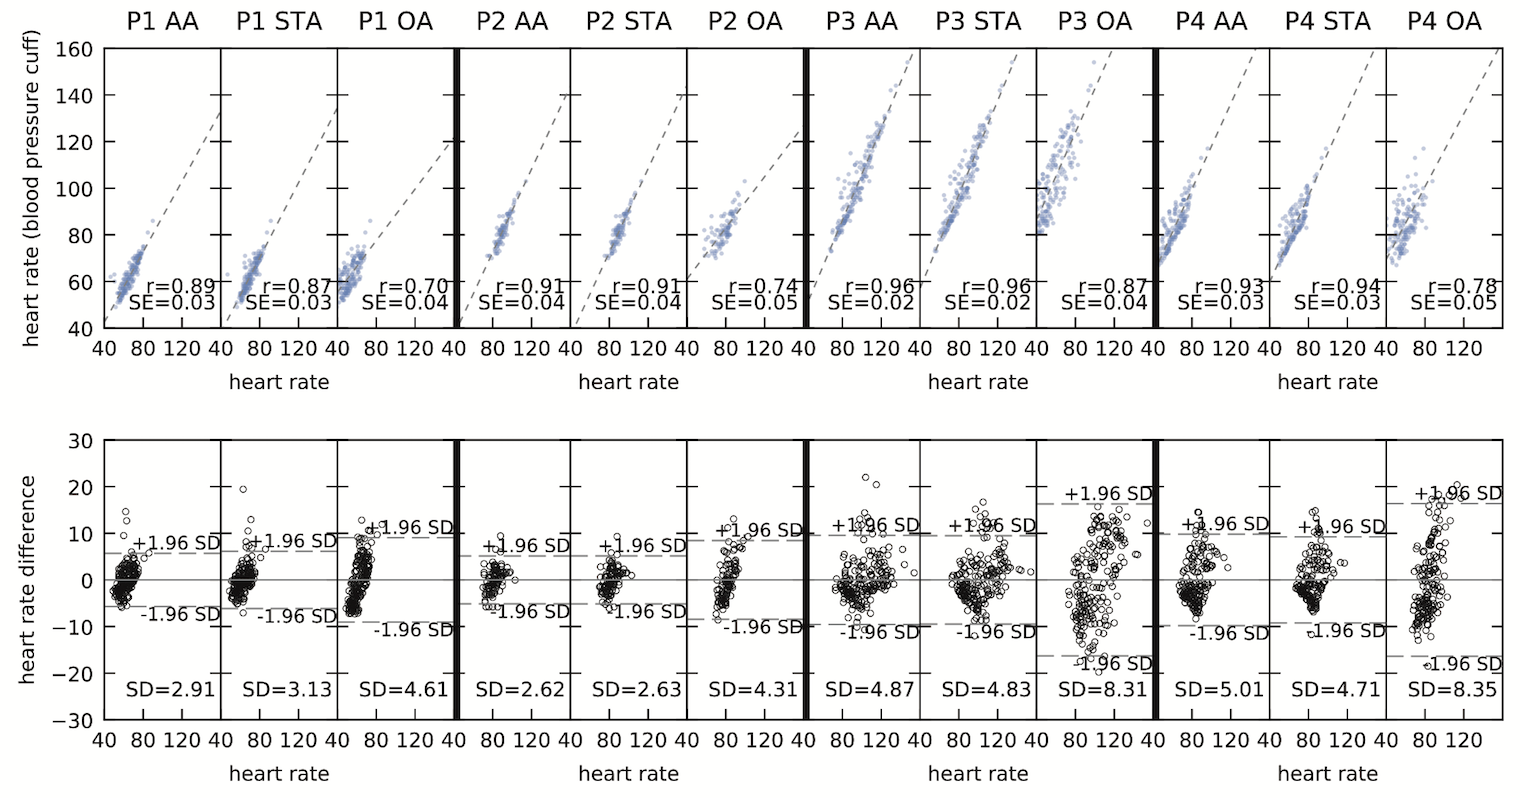
(Top) Correlation of heart rates measured by the commercial blood pressure monitor and each of the three sensors on our prototype devices sampling the angular artery (AA), superficial temporal artery (STA), and occipital artery (OA). (Bottom) Bland-Altman diagram of errors in pulse measurements using our sensors compared to the values from the blood pressure monitor as ground truth.
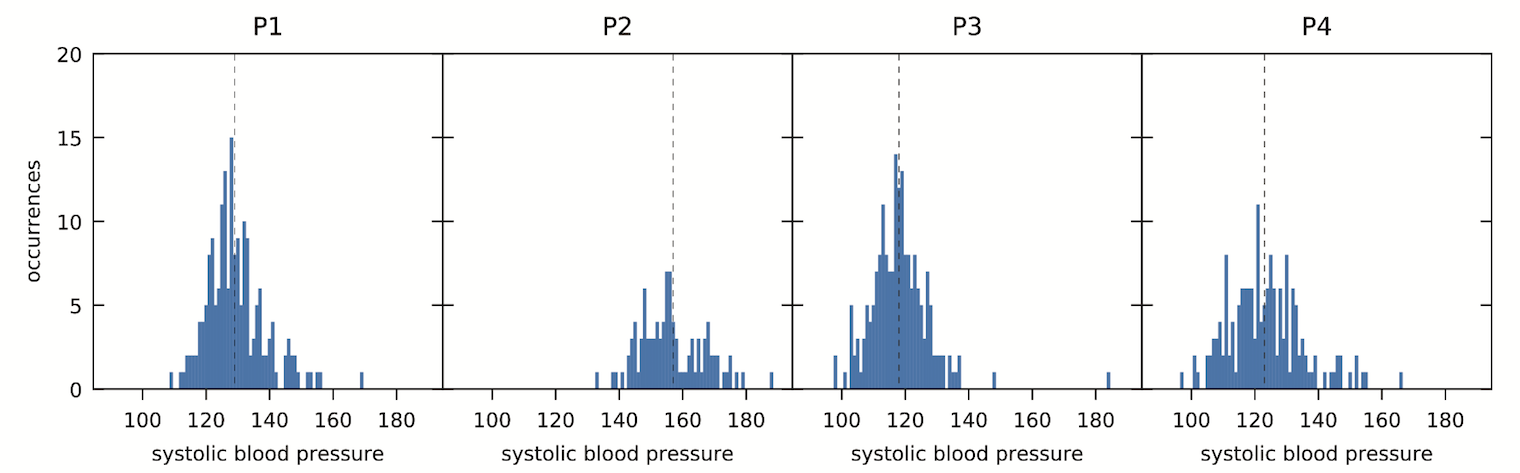
Distribution of systolic blood pressure measurements across the duration of the study for each participant.
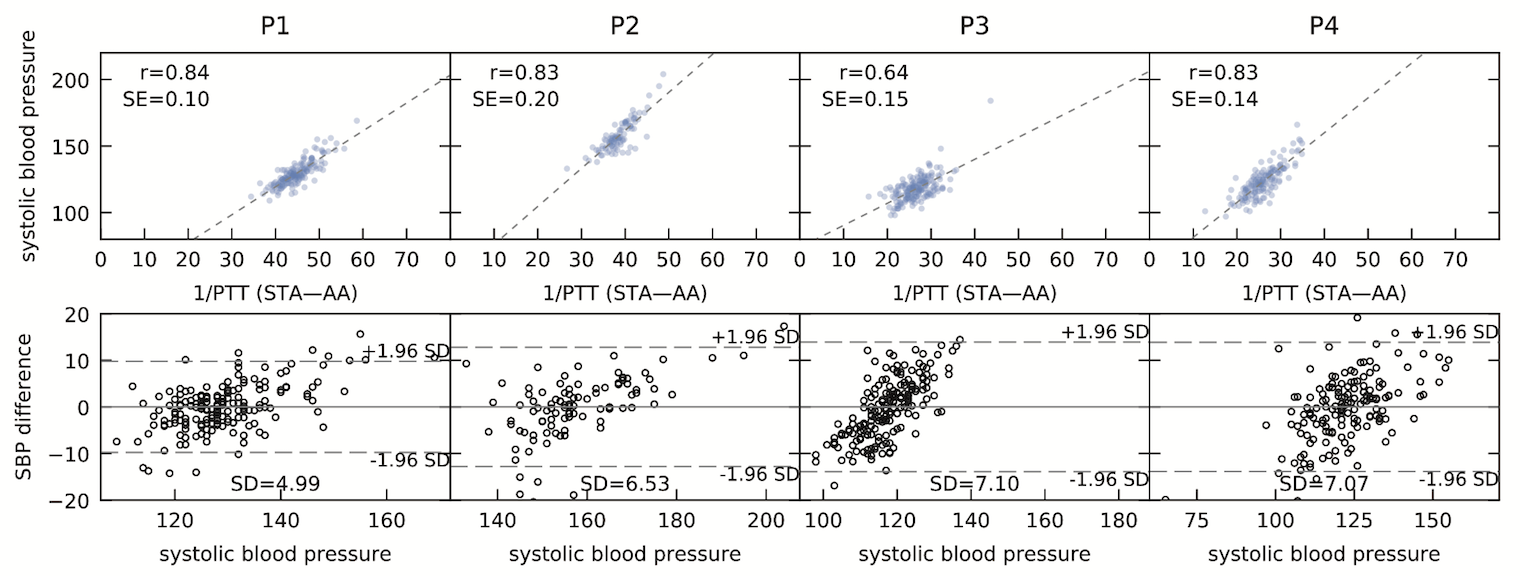
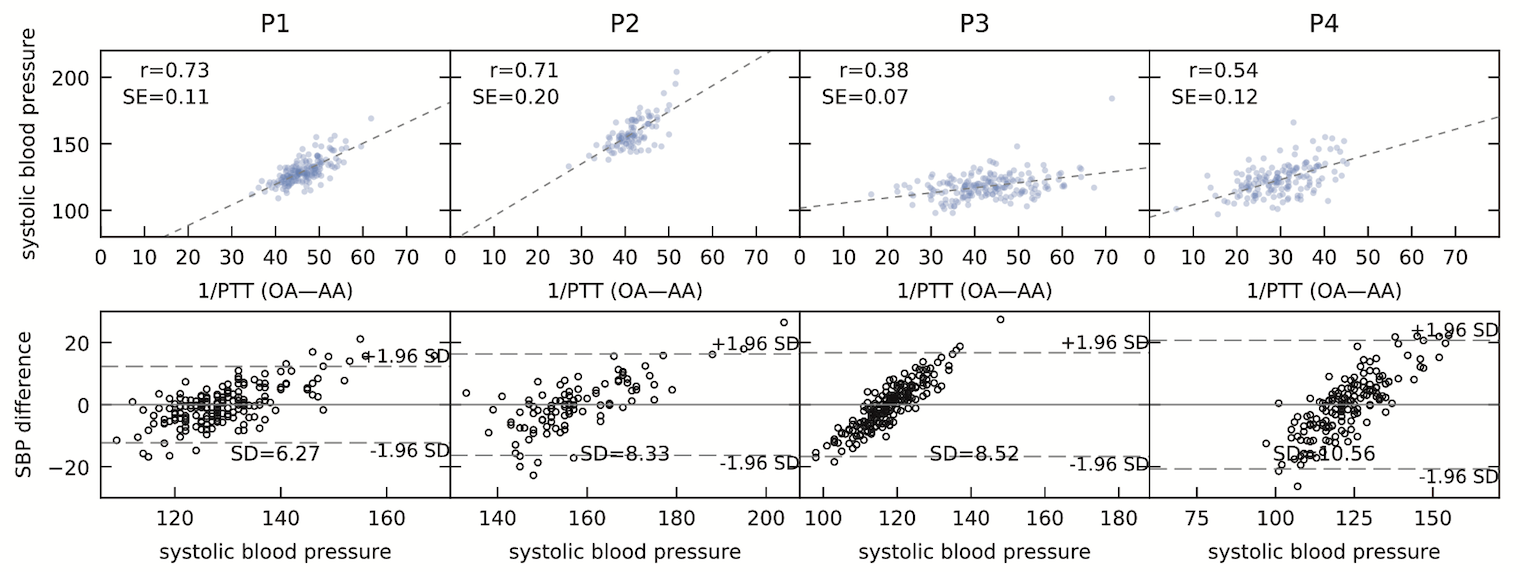
(Top) Correlations of 1/PTT and systolic blood pressure between the angular artery and the superficial temporal artery, as well as the correlation coefficient for a linear model. (Bottom) Bland-Altman diagram of the errors produced by the linear model in predicting systolic blood pressure values based on pulse transit times along the ground-truth values manually recorded by the monitor.
(Top) Correlations of 1/PTT and measured systolic blood pressure values between the angular artery and the occipital artery behind participants' ears, as well as the correlation coefficient for a linear model. (Bottom) Bland-Altman diagram of the errors produced by the linear model along the ground-truth values of the blood pressure monitor.
Acknowledgments
We are indebted to Alexander Ching and Christopher O’Dowd for their thorough help, feedback, and support on hardware design, manufacturing, and assembly. We thank Mike Sinclair, Jason Goldstein, Sokunthea Neang for assistance in iterating on and testing our prototypes as well as Daniel Cletheroe, Pavel Kulik and Andrew Carek for feedback on our approach and a draft of the article. Special thanks to Kambria Tabor for continuous support with logistics and materials.